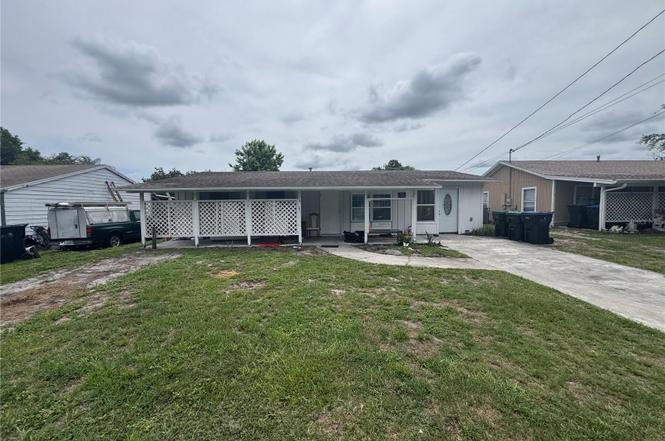
1501 Overdale St
Union Park, FL 32825
$110,000B
3 bd · 1.0 ba ·
1,075 sqft ·
Built 1961
· SingleFamily
· Active
· 1 DOM
Cashflow @ list (25.0% down · 7.5%)
Estimated rent
$2,111/mo
Mortgage (P&I)
−$577
Tax + insurance
−$311
HOA
−$0
Vac / Maint / Mgmt
−$443
Net cashflow
$780/mo
Annual
$9,356/yr
Cap rate
14.80%
Cash-on-cash
30.38%
DSCR
2.35
1% rule
1.92%
Cash to close
$30,800
Investor read
- This is a 3-bed/1.0-bath single-family listed at $110k.
- At list price, monthly cash flow is $780 ($9k/yr) — positive.
- The deal already cash-flows at list — no discount required.
- Meets the 1% rule at list price ($2k rent vs $110k).
- Only 1 days on market — expect competitive offers; lowballing is unlikely to land.
- Local home prices are declining (-3.0%/yr); year-one equity from $761 of loan paydown is wiped out by about $3k of value loss. Plan a longer hold.
- Location reads 79/100 on livability (#153 in FL, #2,308 nationally) — a middle-class / working-renter tenant base. Strengths: housing A+, cost of living A, commute A-; Watch: amenities F, health & safety F.
- Orange (suburban): math 46% / reading 51% proficiency, ranked #43 of 73 in FL (top 59%) — families likely to look elsewhere, expect single-tenant / working-renter base with shorter leases.
- Watch-outs: property tax is 2.9% of price.
- Market conditions: Rents rising (+2.8%/yr); 279 active listings in the ZIP; 32 comparable units currently listed for rent nearby; rentals at typical pace (median 15d on market — plan ~3-4 weeks tenant-placement turnaround); solid renter incomes; 8,053 units permitted in Orange County in 2024 (3,133 in 5+ unit buildings).
- Orange County population projected at +52% by 2050 — long-run rental-demand tailwind backs the buy-and-hold thesis.
- Current owner paid $38k; list at $110k implies a 189% gain — meaningful room to come down on a strong offer.
- At projected returns (-3.0% appreciation + 2.8% rent growth), your $31k cash investment doubles in ~4 years — after that, you're playing with house money.
- Climate carrying-cost: severe wind risk, 99% chance of damaging wind over 30y; extreme-heat days projected 7→24/yr by 2055 (HVAC capex compounding) — expect insurance premiums to compound above CPI over the hold.
- Cap rate 14.8% vs local median 4.2% in Union Park — top-decile yield for the area; either an underpriced asset or a hidden risk that comps aren't pricing in. Stress-test before assuming the spread holds.
- This rent runs 31% of the median local income ($82k/yr) — at the standard rent-burdened threshold; future hikes will face affordability resistance.
Questions for listing agent
- Built in 1961 — when were the roof, HVAC, electrical panel, plumbing, and water heater last replaced?
- Property tax is high relative to price — has the assessment been appealed recently, and will the sale trigger a re-assessment?
- Is there a deadline driving the sale (1031 exchange, divorce, estate, relocation)? That informs how much negotiation room exists.
- Schools are B-rated — typically a magnet for longer-tenancy family renters. What's the average tenant stay here, and is there a school-zone premium baked into asking?
- What's the average days-on-market for RENTAL listings here right now (not sales)? A rising rental-DOM trend means longer vacancies and softer asking-rent achievability than the comps imply.
- What's the recent tenant-quality profile in this submarket — average credit score on applications, eviction rate, late-payment / NSF rate, and stable-employment percentage? A property-management company in the area should have these aggregated.
- How much new for-sale + rental construction is in the pipeline within 1–3 miles? Heavy new supply typically softens prices + rents 12–24 months out; constrained supply supports both.
CashFlowRE · CFR-0GKZEFEVC387RT
· Data 1 day ago
cashflowre.app · 2026-05-29