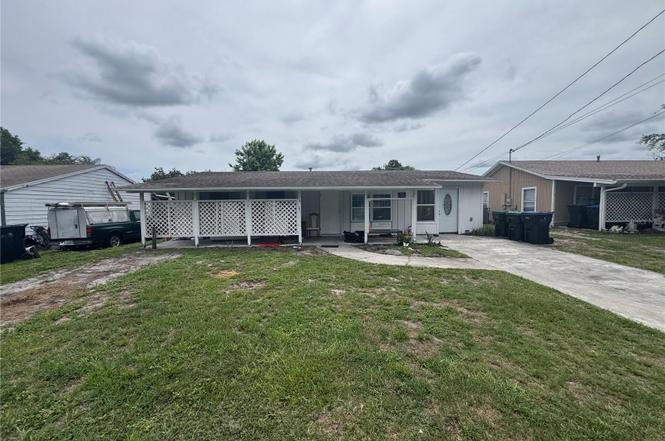
1501 Overdale St · Union Park, FL
Flood risk 1/10 · Minimal
- FEMA flood zone
- X (unshaded)
- Chance of flooding over 30 yrs
- 0.0%
- Est. flood insurance / yr
- $507 – $1,088
Fire risk 3/10 · Minor
- Est. fire insurance / yr
- $947 – $1,759
Heat risk 9/10 · Severe
- Hot days now (above 108°F)
- 7 days/yr
- Hot days in 30 yrs
- 24 days/yr
Wind risk 9/10 · Severe
- Chance of severe wind over 30 yrs
- 99.0%
Air-quality risk 2/10 · Minimal
- Unhealthy air days now
- 0 days/yr
- Unhealthy air days in 30 yrs
- 1 days/yr
Risk factors via First Street. Map © Google.
Why this score? — see what drove the B grade
The composite is a weighted blend of 9 inputs, each scored 0–100. Each bar is that input's sub-score; the figure is the points it added to the 100-point composite (weight × sub-score).
- Cash flow +30.0/30.0
- 1% rule +10.0/10.0
- DSCR +10.0/10.0
- ARV discount +7.5/15.0
- Schools +4.1/10.0
- Livability +4.0/5.0
- Rent growth +3.2/5.0
- Condition / age +2.5/5.0
- Appreciation +0.0/10.0
$110,000
🖨 Deal sheet 📄 Offer letter ✓ Due diligence
Listing remarks
Cash or Hard Money. Aggressively priced to sell!
Key facts
- 8,097 sq ft lot
- Built 1961
Property features AI
Finance
- Other: Property type: Residential, Single Family Residence; Zoning: R-1; Lot size approximately 0.19 acres; Total living area reported as 1,015 square feet (public records); Total building area reported as 1,555 square feet; Total acreage: less than 1/4 acre
- Financial info: Homestead exemption indicated; Lease restrictions apply
- HOA & community: No additional association indicated
Exterior
- Utilities: Public water; Septic tank and other sewer; Other utilities
- Home design: Single-family residence; Fixer condition; Faces west; One story; Entry level: One
- Construction: Metal siding; Vinyl siding; Frame construction; Other roof; Slab foundation; Built on or before public record living area of 1,015
- Exterior features: Other exterior features; Road surfaces: Asphalt, Concrete, Paved
Interior
- Bedrooms: 3 bedrooms
- Flooring: Other flooring
- Bathrooms: 1 full bathroom
- Heating & cooling: Central heating; Central air conditioning
- Interior features: Other interior features
- Laundry & utility: Laundry: Other
Neighborhood map
What this means for you Summary
Snapshot
- This is a 3-bed/1.0-bath single-family listed at $110k.
Deal economics
- At list price, monthly cash flow is $780 ($9k/yr) — positive.
- The deal already cash-flows at list — no discount required.
- Meets the 1% rule at list price ($2k rent vs $110k).
- Cap rate 14.8% vs local median 4.2% in Union Park — top-decile yield for the area; either an underpriced asset or a hidden risk that comps aren't pricing in. Stress-test before assuming the spread holds.
Location & tenants
- Location reads 79/100 on livability (#153 in FL, #2,308 nationally) — a middle-class / working-renter tenant base. Strengths: housing A+, cost of living A, commute A-; Watch: amenities F, health & safety F.
- Orange (suburban): math 46% / reading 51% proficiency, ranked #43 of 73 in FL (top 59%) — families likely to look elsewhere, expect single-tenant / working-renter base with shorter leases.
- Market conditions: Rents rising (+2.8%/yr); 279 active listings in the ZIP; 32 comparable units currently listed for rent nearby; rentals at typical pace (median 15d on market — plan ~3-4 weeks tenant-placement turnaround); solid renter incomes; 8,053 units permitted in Orange County in 2024 (3,133 in 5+ unit buildings).
- This rent runs 31% of the median local income ($82k/yr) — at the standard rent-burdened threshold; future hikes will face affordability resistance.
Forward outlook
- Local home prices are declining (-3.0%/yr); year-one equity from $761 of loan paydown is wiped out by about $3k of value loss. Plan a longer hold.
- Orange County population projected at +52% by 2050 — long-run rental-demand tailwind backs the buy-and-hold thesis.
- At projected returns (-3.0% appreciation + 2.8% rent growth), your $31k cash investment doubles in ~4 years — after that, you're playing with house money.
Negotiation context
- Only 1 days on market — expect competitive offers; lowballing is unlikely to land.
- Current owner paid $38k; list at $110k implies a 189% gain — meaningful room to come down on a strong offer.
Risks & watch-outs
- Watch-outs: property tax is 2.9% of price.
- Climate carrying-cost: severe wind risk, 99% chance of damaging wind over 30y; extreme-heat days projected 7→24/yr by 2055 (HVAC capex compounding) — expect insurance premiums to compound above CPI over the hold.
Questions for the listing agent
- Built in 1961 — when were the roof, HVAC, electrical panel, plumbing, and water heater last replaced?
- Property tax is high relative to price — has the assessment been appealed recently, and will the sale trigger a re-assessment?
- Is there a deadline driving the sale (1031 exchange, divorce, estate, relocation)? That informs how much negotiation room exists.
- Schools are B-rated — typically a magnet for longer-tenancy family renters. What's the average tenant stay here, and is there a school-zone premium baked into asking?
- What's the average days-on-market for RENTAL listings here right now (not sales)? A rising rental-DOM trend means longer vacancies and softer asking-rent achievability than the comps imply.
- What's the recent tenant-quality profile in this submarket — average credit score on applications, eviction rate, late-payment / NSF rate, and stable-employment percentage? A property-management company in the area should have these aggregated.
- How much new for-sale + rental construction is in the pipeline within 1–3 miles? Heavy new supply typically softens prices + rents 12–24 months out; constrained supply supports both.
Investment metrics
- 1% rule
- 1.92% ✓
- Cap rate
- 14.80%
- Cash-on-cash
- 30.38%
- DSCR
- 2.35
- GRM
- 4.3
CMA / ARV
- ARV (on-the-fly)
- $292,400
- Comps found
- 8
Show comp detail 8 sales within ~0.75 mi
| Address | Dist | Beds/Ba | Sqft | Sold | Price | $/sf | Match |
|---|---|---|---|---|---|---|---|
| 1517 Overdale St | 0.05mi | 3/1.0 | 1,125 (+5%) | 22mo | $280,000 | $249 | 72 |
| 9148 Dubois Blvd | 0.40mi | 3/2.0 | 1,086 (+1%) | 4mo | $295,800 | $272 | 72 |
| 1456 Brookebridge Dr | 0.05mi | 2/2.0 (-1) | 936 (-13%) | 0mo | $280,000 | $299 | 67 |
| 1115 Overdale St | 0.26mi | 4/2.0 (+1) | 1,015 (-6%) | 13mo | $242,000 | $238 | 59 |
| 1200 Vonderay Rd | 0.27mi | 3/1.5 | 1,225 (+14%) | 8mo | $317,500 | $259 | 56 |
| 9393 Dubois Blvd | 0.58mi | 3/2.0 | 1,133 (+5%) | 14mo | $265,320 | $234 | 49 |
| 846 Bella Vista Way | 0.72mi | 3/2.0 | 1,066 (-1%) | 23mo | $338,000 | $317 | 42 |
| 719 Oak Manor Cir | 0.71mi | 3/2.0 | 1,218 (+13%) | 7mo | $345,000 | $283 | 35 |
Match score weights: distance 35% · size 25% · config 20% · recency 20%. Top-matched comps best support the ARV.
Projected returns pro-forma
-3.0% appreciation · 2.77% rent growth · sell at horizon
- IRR
- 24.8%
- Equity multiple
- 2.02×
- Total profit
- $31,454
- Equity at exit
- $16,401
- IRR
- 32.5%
- Equity multiple
- 3.92×
- Total profit
- $89,787
- Equity at exit
- $9,511
Cash invested: $30,800 (down + closing). Projections, not guarantees.
Landlord ↔ Tenant lean methodology
- Overall (STATE)
- 87 Strongly Landlord-Friendly
- State Florida
- 87 Strongly Landlord-Friendly · R+3
- County
- — inherits STATE
- City
- — inherits STATE
ZIP-level market 32825
- Rents YoY
- 2.8%
- Active inventory
- 279
- Price-to-rent
- 4.3×
Monthly cashflow live
- Estimated rent
- $2,111 high interval (Pro) →
- Mortgage (P&I)
- −$577
- Tax from tax record
- −$265 /mo · $3,180/yr
- Insurance
- −$46
- HOA
- −$0
- Vacancy / Maint / Mgmt
- −$443
- Net cashflow
- $780
Break-even live
UW: 25.0% down · 7.5% · 30yr · 1.5% tax · 5.0% vac · 8.0% maint · 8.0% mgmt
Financing live
Cash to close
- Down payment
- $27,500
- Closing costs
- $3,300
- Reserves months
- —
- Total cash needed
- —
Loan-product check · same deal, 3 products live
Conventional
25% down · 7.5% · 30yr
- Down + closing
- —
- Monthly P&I
- —
- Monthly cashflow
- —
- DSCR
- —
- Eligible?
- —
Personal DTI + credit; lowest rate.
DSCR
20% down · 8.5% · 30yr
- Down + closing
- —
- Monthly P&I
- —
- Monthly cashflow
- —
- DSCR
- —
- Eligible?
- —
No personal income docs; deal must DSCR.
Hard money
10% down · 12.0% · 12mo
- Down + closing
- —
- Monthly P&I
- —
- Monthly cashflow
- —
- DSCR
- —
- Eligible?
- —
Short-term bridge; refi at stabilization.
Rent comps 32 comps
| Address | Beds | Baths | Sqft | Rent | $/sqft | DOM | Units | Dist |
|---|---|---|---|---|---|---|---|---|
| 1108 Constantine St Orlando, FL | 4.0 | 2.0 | 1491 | $2,375 | $1.59 | 11d | 1 | 0.27mi |
| 1108 Constantine St Orlando, FL | 4.0 | 2.0 | 1491 | $2,350 | $1.58 | 2d | 1 | 0.27mi |
| 1228 Pine Sap Ct Orlando, FL | 3.0 | 2.0 | 1366 | $2,300 | $1.68 | 12d | 1 | 0.28mi |
| 933 Vista Palma Way Orlando, FL | 3.0 | 2.0 | 1016 | $2,150 | $2.12 | 24d | 1 | 0.57mi |
| 2282 Grenwich Ave #2282 Orlando, FL | 2.0 | 2.0 | 978 | $1,345 | $1.38 | 24d | 1 | 0.70mi |
| 9201 Nelson Park Cir Orlando, FL | 1.0–3.0 | 1.0–2.0 | 844 | $1,839 | $2.18 | 2d | 25 | 0.74mi |
| 1000 Avery Village Loop Orlando, FL | 2.0–3.0 | 2.0 | 1206 | $2,327 | $1.93 | 1d | 13 | 0.85mi |
| 2300 Econ Cir Orlando, FL | 1.0–2.0 | 1.0–2.0 | 897 | $1,558 | $1.74 | 14d | 1 | 0.86mi |
| 1000 Avida Village Cir Orlando, FL | 1.0–3.0 | 1.0–2.0 | 977 | $2,488 | $2.55 | 1d | 22 | 0.90mi |
| 466 Valencia Place Cir Orlando, FL | 3.0 | 2.0 | 1184 | $2,470 | $2.09 | 11d | 1 | 0.92mi |
| 8211 Sun Spring Cir #41 Orlando, FL | 2.0 | 2.0 | 1064 | $1,499 | $1.41 | 4d | 1 | 0.99mi |
| 8215 Sun Spring Cir #23 Orlando, FL | 2.0 | 2.0 | 1064 | $1,550 | $1.46 | 22d | 1 | 1.03mi |
| 1222 Tino Ct Orlando, FL | 2.0 | 2.0 | 1000 | $1,575 | $1.57 | 7d | 1 | 1.06mi |
| 2526 Poet Ln Orlando, FL | 3.0 | 2.0 | 1176 | $2,300 | $1.96 | 22d | 1 | 1.06mi |
| 2526 Poet Ln Orlando, FL | 4.0 | 2.0 | 1276 | $2,300 | $1.80 | 20d | 1 | 1.06mi |
| 10039 Massey St Orlando, FL | 2.0 | 2.0 | 948 | $1,595 | $1.68 | 2d | 1 | 1.10mi |
| 10041 Massey St Alafaya, FL | 2.0 | 2.0 | 948 | $1,595 | $1.68 | 24d | 1 | 1.10mi |
| 7909 Richwood Dr Orlando, FL | 2.0 | 2.0 | 936 | $1,950 | $2.08 | 22d | 1 | 1.13mi |
| 8693 Foley Dr Orlando, FL | 3.0 | 2.0 | 1178 | $1,500 | $1.27 | 24d | 1 | 1.14mi |
| 469 Glastonbury Dr Orlando, FL | 3.0 | 2.5 | 1300 | $2,195 | $1.69 | 22d | 1 | 1.20mi |
| 1312 Ravida Cir Orlando, FL | 2.0 | 2.0 | 1044 | $1,650 | $1.58 | 3d | 1 | 1.21mi |
| 949 Crowsnest Cir Orlando, FL | 1.0–2.0 | 1.0–2.0 | 822 | $1,754 | $2.13 | 1d | 31 | 1.21mi |
| 8225 Claire Ann Dr #203 Orlando, FL | 2.0 | 2.0 | 1046 | $1,725 | $1.65 | 3d | 1 | 1.22mi |
| 604 Laurel Cove Ct Orlando, FL | 1.0–3.0 | 1.0–2.0 | 892 | $1,968 | $2.21 | 1d | 15 | 1.23mi |
| 8103 Lillies Way #107 Orlando, FL | 2.0 | 2.0 | 1000 | $1,600 | $1.60 | 7d | 1 | 1.24mi |
| 8137 Claire Ann Dr #207 Orlando, FL | 2.0 | 2.0 | 1046 | $1,750 | $1.67 | 22d | 1 | 1.28mi |
| 9524 Buxton Ct Orlando, FL | 4.0 | 2.0 | 1476 | $2,560 | $1.73 | 22d | 1 | 1.33mi |
| 1509 Regan Ave Orlando, FL | 4.0 | 2.0 | 1382 | $2,375 | $1.72 | 11d | 1 | 1.35mi |
| 9942 Dean Oaks Ct Orlando, FL | 3.0 | 2.0 | 1140 | $2,095 | $1.84 | 22d | 1 | 1.36mi |
| 2211 River Park Cir Orlando, FL | 1.0–3.0 | 1.0–2.0 | 888 | $1,928 | $2.17 | 22d | 1 | 1.42mi |
| 2515 Long Meadow Way Orlando, FL | 3.0 | 2.0 | 1200 | $2,315 | $1.93 | 20d | 1 | 1.47mi |
| 1206 Culver Rd Orlando, FL | 2.0 | 2.0 | 1241 | $2,550 | $2.05 | 24d | 1 | 1.48mi |
Listing history 2 events
-
2026-06-19remarks 48-char remark
-
2026-06-19$110,000 Active 1 DOM
ⓘ Source: listings_history table (triggers on properties + properties_extension) + one-shot
backfill from property_details.listing_events for pre-trigger history.
Tax reassessment forecast FL · Resets to sale price
- Current annual tax
- $3,180 · $265/mo
- Projected year-2 tax
- $3,180 · $265/mo
- Expected delta
- $0/yr ($0/mo · 0.0%)
ⓘ Screening estimate from a state-policy table — verify with the county assessor before closing.
Climate risk First Street
- Flood 1/10 Low FEMA zone X (unshaded) · 0% chance over 30 yrs
- Wildfire 3/10 Moderate
- Heat 9/10 Extreme 7 d/yr ≥108°F today · 24 d/yr by 30 yrs out
- Wind 9/10 Extreme 99% chance of damaging wind over 30 yrs
- Air quality 2/10 Low 0 unhealthy d/yr today · 1 by 30 yrs out
Nearby sold comps map
Loading sold comps map…
Walkable amenities ~0.75 mi
Loading nearby amenities…
Taxation est. · year 1
- Rental income
- $25,326
- − Mortgage interest
- −$6,162
- − Property taxes
- −$3,180
- − Insurance
- −$550
- − Repairs & maintenance
- −$2,026
- − Management
- −$2,026
- − Depreciation
- −$3,200
- Taxable income
- $8,183
- Est. tax owed @ 24.0%
- −$1,964
- After-tax cash flow
- $7,392/yr
For passive investors: Depreciation is non-cash, so a rental often shows a tax loss while cash-flowing — sheltering income. Rental losses are passive: they offset passive income freely, and up to $25,000/yr can offset ordinary (W-2) income if you actively participate and your MAGI is under $100k (phasing out to $0 by $150k); unused losses carry forward. On sale, claimed depreciation is recaptured at up to 25%, and gains may owe capital-gains tax (a 1031 exchange can defer both). Figures are a year-1 estimate at your 24.0% rate — not tax advice; consult a CPA.
Schools (NCES district)
- District
- Orange
- NCES district ID
- 1201440
- Math proficiency
- 46% ▼ -9.00%
- Reading proficiency
- 51% ▼ -2.00%
- Median HH income
- $49,350
- Composite
- 41.47/100
- National rank
- #3461
- State rank
- #43 of 73 in FL
Livability — Union Park
- Score
- 79/100
- State rank
- #153
- US rank
- #2308
Category grades
Schools grade is shown separately in the Schools card above.
Census & demographics
- County
- Orange County · 1,471,359 people
- Metro
- Orlando-Kissimmee-Sanford, FL
- Population (ZIP)
- 63,698
- Household income
- $81,651
- Rent vs Own
- Severe rent burden
- 1458.0
Population outlook (Orange County) Hauer SSP2
- Today (2025)
- 1,618,226 people
- By 2030
- 1,787,404 · +10.5%
- By 2040
- 2,125,621 · +31.4%
- By 2050
- 2,454,016 · +51.6%
- By 2075
- 3,173,711 · +96.1%
- By 2100
- 3,607,781 · +122.9%
Race, ethnicity, and origin ACS 2023
- Neighborhood character
- Diverse neighborhood (Simpson 0.66)
- Race & ethnicity
- Hispanic / Latino 47% White 32% Two or more races 23% Black 11% Asian 7%
- Hispanic origin (detail)
- Mexican 2% Puerto Rican 25% Cuban 6% Dominican 3%
- Common ancestry
- Lithuanian 1% Romanian 1% Slovak 1%
- Foreign-born
- 20% · Canada, Vietnam, Jamaica
- Languages at home
- 56% English-only · Spanish 35% Other Indo-European 3% Vietnamese 2%
Political lean MEDSL · Orange
- 2024 margin
- D (+13.6) · D 56.1% · R 42.5% · Other 1.3%
- 2008→2024 swing
- -5.0pp toward R · 2008: 18.6pp · 2024: 13.6pp
- All cycles
- 2024: D+13.6 2020: D+23.1 2016: D+24.6 2012: D+18.2 2008: D+18.6
Not yet ingested
- Civics
- —
Market trends
- HPI YoY
- ▼ -171.52%
- Current HPI
- 315.8496
- Rent YoY
- ▲ 2.77%
- Metro
- Orlando-Kissimmee-Sanford, FL
- State GDP YoY
- ▲ 3.28%
- F500 in state
- 36
Industry mix (Fortune 500 HQ in FL)
| Industry | F500 HQs | Revenue |
|---|---|---|
| Industrial Technology | 2 | $29B |
|
||
| Insurance | 2 | $17B |
|
||
| Retail | 1 | $60B |
|
||
| Technology Distribution | 1 | $58B |
|
||
| Homebuilding | 1 | $35B |
|
||
| Technology Manufacturing | 1 | $35B |
|
||
Price history
+189.5% since first listed2 events — show timeline
- 2026-06-18 Listed $110,000 Stellar MLS as Distributed by MLS Grid
- 1993-11-01 Sold (Public Records) $38,000 Public Records
Property tax history
+9.5%/yrLatest (2025): $3,180 · +8.9% YoY. Source: county tax records.
Cash-flow waterfall
monthlySold comps — $/sqft
last 12 mo · ≤1 miLoading sold comps…