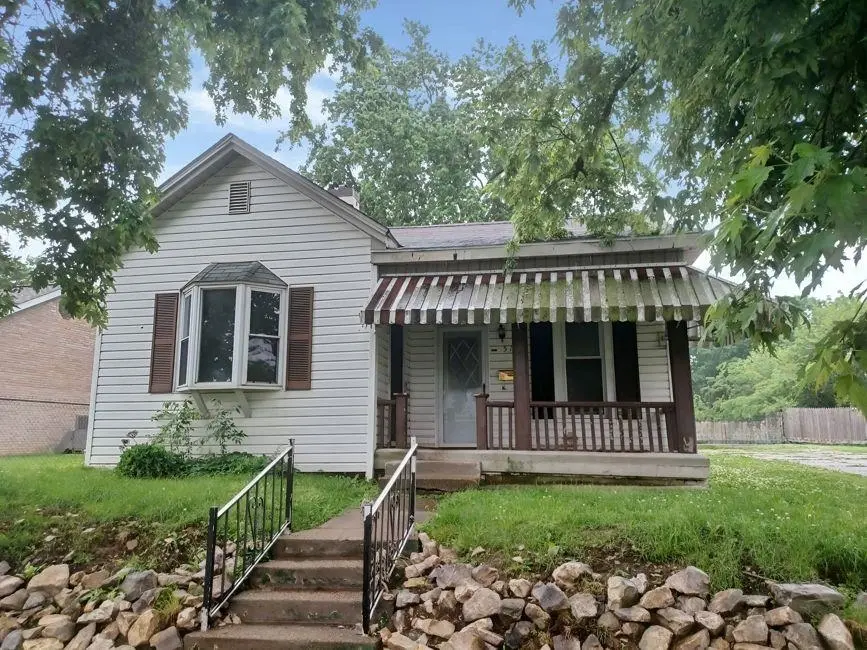
518 Fagan St
Henderson, KY 42420
$34,500B-
1 bd · 1.0 ba ·
1,028 sqft ·
Built 1914
· SingleFamily
· Active
· 6 DOM
Cashflow @ list (25.0% down · 7.5%)
Estimated rent
$799/mo
Mortgage (P&I)
−$181
Tax + insurance
−$58
HOA
−$0
Vac / Maint / Mgmt
−$168
Net cashflow
$393/mo
Annual
$4,713/yr
Cap rate
19.96%
Cash-on-cash
48.79%
DSCR
3.17
1% rule
2.32%
Cash to close
$9,660
Investor read
- This is a 1-bed/1.0-bath single-family listed at $34k.
- At list price, monthly cash flow is $393 ($5k/yr) — positive.
- The deal already cash-flows at list — no discount required.
- Meets the 1% rule at list price ($799 rent vs $34k).
- Only 6 days on market — expect competitive offers; lowballing is unlikely to land.
- Local home prices are declining (-3.0%/yr); year-one equity from $239 of loan paydown is wiped out by about $1k of value loss. Plan a longer hold.
- Location reads 74/100 on livability (#114 in KY, #4,949 nationally) — a middle-class / working-renter tenant base. Strengths: cost of living A+, housing A+, health & safety A+; Watch: employment D, amenities F, commute F.
- Henderson County (suburban): math 40% / reading 41% proficiency, ranked #29 of 165 in KY (top 18%) — families likely to look elsewhere, expect single-tenant / working-renter base with shorter leases.
- Zoned schools: South Heights Elementary School (math 12% / reading 22%, grade F, #607 of 676 statewide, top 91%, 420 students, 74% FRL) — zoned schools average 74% FRL vs 53% district-wide (21 pts higher); higher-poverty schools than district average — tighter screening recommended.
- Zoned-school proficiency averages 17% at this address vs 40% district-wide (-24 pts) — the specific schools serving this property underperform the Henderson County average; the district grade overstates school quality for this exact location.
- Watch-outs: built in 1914 — expect roof / HVAC / electrical / plumbing capex.
- Market conditions: 228 active listings in the ZIP; 1 comparable units currently listed for rent nearby; 92 units permitted in Henderson County in 2024 (0 in 5+ unit buildings).
- Henderson County population projected to shrink 5% by 2050 — rents likely to lag national; underwrite the cash flow, not the appreciation.
- At projected returns (-3.0% appreciation + 3.0% rent growth), your $10k cash investment doubles in ~3 years — after that, you're playing with house money.
- Climate carrying-cost: extreme-heat days projected 7→19/yr by 2055 (HVAC capex compounding) — expect insurance premiums to compound above CPI over the hold.
Questions for listing agent
- Built in 1914 — when were the roof, HVAC, electrical panel, plumbing, and water heater last replaced?
- Is there a deadline driving the sale (1031 exchange, divorce, estate, relocation)? That informs how much negotiation room exists.
- What's the average days-on-market for RENTAL listings here right now (not sales)? A rising rental-DOM trend means longer vacancies and softer asking-rent achievability than the comps imply.
- What's the recent tenant-quality profile in this submarket — average credit score on applications, eviction rate, late-payment / NSF rate, and stable-employment percentage? A property-management company in the area should have these aggregated.
- How much new for-sale + rental construction is in the pipeline within 1–3 miles? Heavy new supply typically softens prices + rents 12–24 months out; constrained supply supports both.
CashFlowRE · CFR-0HMHXQ4SAXNA3P
· Data 2 days ago
cashflowre.app · 2026-05-29