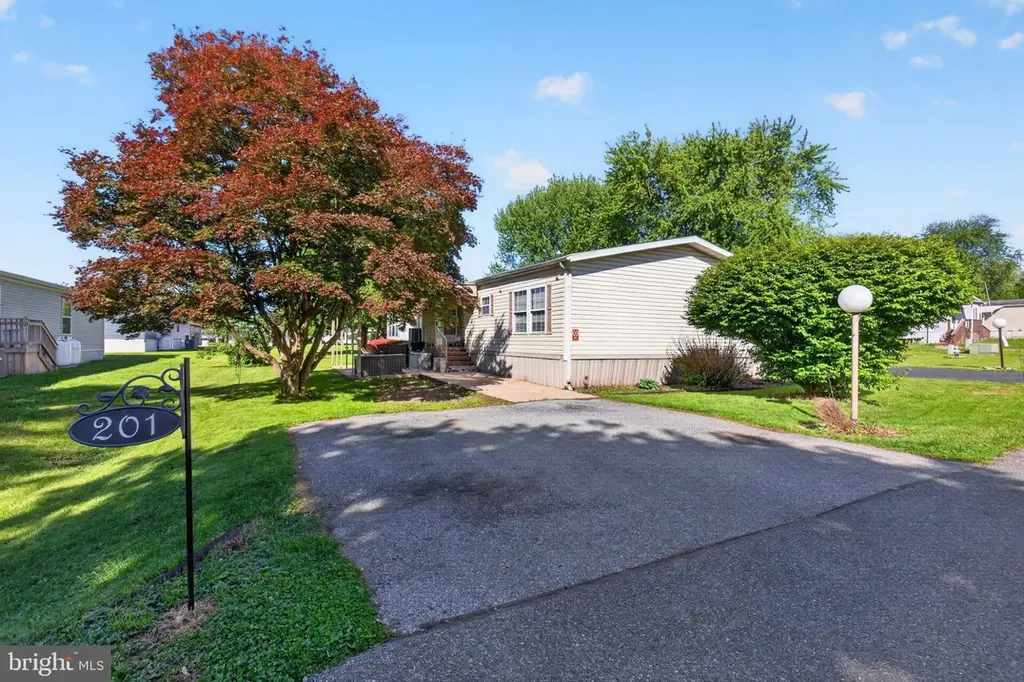
201 Northcrest Acrs
Avon, PA 17046
$83,000B
3 bd · 2.0 ba ·
1,852 sqft ·
Built 1991
· Manufactured
· Pending
· 21 DOM
Cashflow @ list (25.0% down · 7.5%)
Estimated rent
$1,682/mo
Mortgage (P&I)
−$435
Tax + insurance
−$108
HOA
−$0
Vac / Maint / Mgmt
−$353
Net cashflow
$785/mo
Annual
$9,424/yr
Cap rate
17.65%
Cash-on-cash
40.55%
DSCR
2.80
1% rule
2.03%
Cash to close
$23,240
Investor read
- This is a 3-bed/2.0-bath manufactured listed at $83k.
- At list price, monthly cash flow is $785 ($9k/yr) — positive.
- The deal already cash-flows at list — no discount required.
- Meets the 1% rule at list price ($2k rent vs $83k).
- It's been on market 21 days — a 2% lower offer ($82k) is reasonable based on typical stale-listing flexibility.
- Recommended offer: $82k (1.5% below list) — sets the bar for market timing.
- Local home prices are declining (-3.0%/yr); year-one equity from $574 of loan paydown is wiped out by about $2k of value loss. Plan a longer hold.
- Location reads 74/100 on livability (#483 in PA, #4,457 nationally) — a middle-class / working-renter tenant base. Strengths: crime A+, employment A+, cost of living A+; Watch: amenities F, commute F, health & safety F.
- Cornwall-Lebanon SD (suburban): math 37% / reading 56% proficiency, ranked #219 of 539 in PA (top 41%) — families likely to look elsewhere, expect single-tenant / working-renter base with shorter leases.
- Zoned schools: Union Canal El Sch (math 33% / reading 46%, grade F, #947 of 1,518 statewide, top 65%, 406 students, 62% FRL) — zoned schools average 62% FRL vs 26% district-wide (36 pts higher); higher-poverty schools than district average — tighter screening recommended.
- Market conditions: Rents rising fast (+7.4%/yr); 121 active listings in the ZIP; 1 comparable units currently listed for rent nearby; 315 units permitted in Lebanon County in 2024 (36 in 5+ unit buildings).
- Lebanon County population projected at +10% by 2050 — modest demand growth; plan on rents tracking national, not racing it.
- 3 sale attempts since 12y ago; this cycle's ask has dropped $12k (12%) from the opening price — seller is motivated, your offer sets the floor, not the list.
- Current owner paid $39k; list at $83k implies a 113% gain — meaningful room to come down on a strong offer.
- At projected returns (-3.0% appreciation + 7.4% rent growth), your $23k cash investment doubles in ~3 years — after that, you're playing with house money.
- Climate carrying-cost: extreme-heat days projected 7→15/yr by 2055 (HVAC capex compounding) — expect insurance premiums to compound above CPI over the hold.
- This rent runs 32% of the median local income ($62k/yr) — at the standard rent-burdened threshold; future hikes will face affordability resistance.
Questions for listing agent
- Is there a deadline driving the sale (1031 exchange, divorce, estate, relocation)? That informs how much negotiation room exists.
- Schools are F-rated, which usually means shorter tenancies and higher turnover. Who's the typical renter profile here, and what's been the actual vacancy rate?
- What's the average days-on-market for RENTAL listings here right now (not sales)? A rising rental-DOM trend means longer vacancies and softer asking-rent achievability than the comps imply.
- What's the recent tenant-quality profile in this submarket — average credit score on applications, eviction rate, late-payment / NSF rate, and stable-employment percentage? A property-management company in the area should have these aggregated.
- How much new for-sale + rental construction is in the pipeline within 1–3 miles? Heavy new supply typically softens prices + rents 12–24 months out; constrained supply supports both.
CashFlowRE · CFR-0JPM3H3W2CX359
· Data 1 day ago
cashflowre.app · 2026-05-29