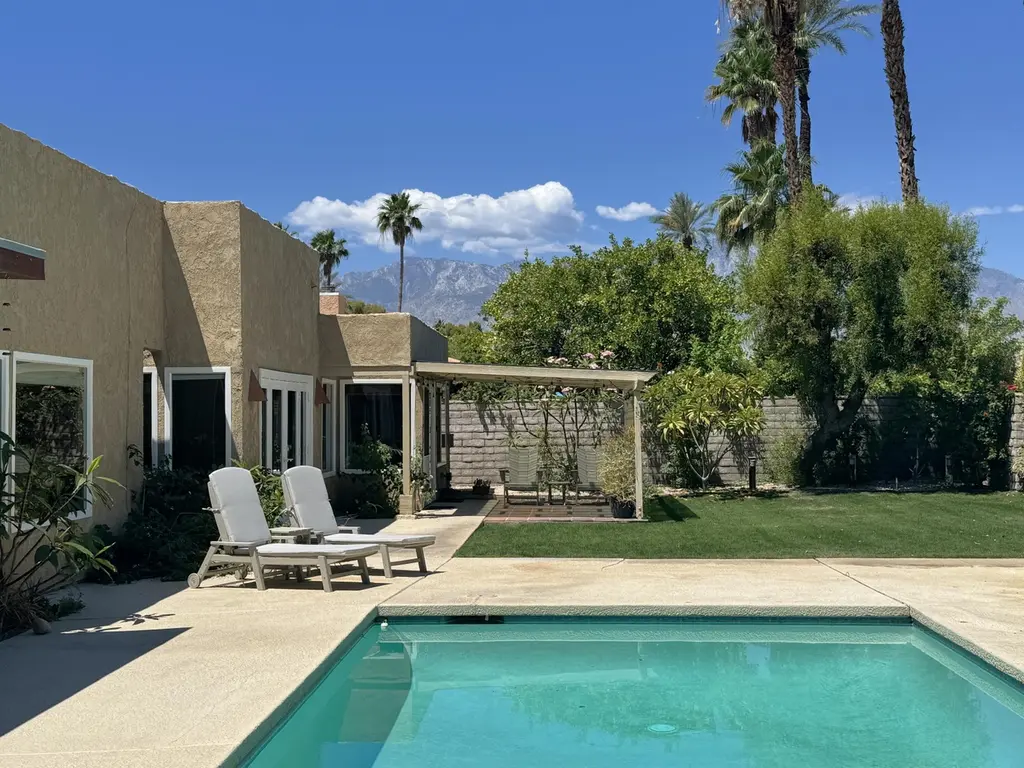
70900 Jasmine Ln
Rancho Mirage, CA 92270
$950,000F
4 bd · 2.5 ba ·
2,539 sqft ·
Built 1980
· SingleFamily
· Active
· 45 DOM
Cashflow @ list (25.0% down · 7.5%)
Estimated rent
$6,404/mo
Mortgage (P&I)
−$4,982
Tax + insurance
−$1,141
HOA
−$0
Vac / Maint / Mgmt
−$1,345
Net cashflow
$-1,064/mo
Annual
$-12,762/yr
Cap rate
4.95%
Cash-on-cash
-4.80%
DSCR
0.79
1% rule
0.67%
Cash to close
$266,000
Investor read
- This is a 4-bed/2.5-bath single-family listed at $950k.
- At list price, monthly cash flow is $-1k ($-13k/yr) — negative.
- To cash-flow at today's rent, offer at most $762k (19.8% below list).
- To meet the 1% rule (rent ≥ 1% of price), the offer needs to be $640k (32.6% below list).
- It's been on market 45 days — a 3% lower offer ($922k) is reasonable based on typical stale-listing flexibility.
- Recommended offer: $640k (32.6% below list) — sets the bar for 1% rule.
- Local home prices are declining (-3.0%/yr); year-one equity from $7k of loan paydown is wiped out by about $28k of value loss. Plan a longer hold.
- Location reads 51/100 on livability (#1,065 in CA) — a working-class tenant base; expect higher turnover. Strengths: employment A+; Watch: amenities F, commute F, cost of living F.
- Palm Springs Unified (suburban): math 21% / reading 42% proficiency, ranked #328 of 517 in CA (top 63%) — families likely to look elsewhere, expect single-tenant / working-renter base with shorter leases; 73% free/reduced lunch — lower-income household profile, screen leases tightly.
- Zoned schools: Rancho Mirage Elementary (309 students, 86% FRL); Nellie N. Coffman Middle (953 students, 98% FRL); Rancho Mirage High (math 15% / reading 38%, grade F, #804 of 1,170 statewide, top 69%, 1,491 students, 97% FRL) — zoned schools average 94% FRL vs 73% district-wide (20 pts higher); higher-poverty schools than district average — tighter screening recommended.
- Market conditions: Rents rising (+3.7%/yr); 532 active listings in the ZIP; 40 comparable units currently listed for rent nearby; rentals lingering (median 46d on market — plan ~5-8 weeks vacancy on turnover, expect pricing pressure); 60% of comp listings sitting > 30 days — soft ceiling on asking rent; solid renter incomes; 9,195 units permitted in Riverside County in 2024 (1,512 in 5+ unit buildings).
- Riverside County population projected at +22% by 2050 — long-run rental-demand tailwind backs the buy-and-hold thesis.
- 2 sale attempts since 7y ago; this cycle's ask is 6% above the opening price — seller raised mid-cycle; expect resistance to lowballs.
- Current owner paid $607k; list at $950k implies a 56% gain — meaningful room to come down on a strong offer.
- Climate carrying-cost: extreme-heat days projected 7→20/yr by 2055 (HVAC capex compounding) — expect insurance premiums to compound above CPI over the hold.
- Cap rate 4.9% vs local median 3.0% in Rancho Mirage — top-decile yield for the area; either an underpriced asset or a hidden risk that comps aren't pricing in. Stress-test before assuming the spread holds.
- At $6,404/mo this rent would consume 72% of the median local household income ($107k/yr) (locally 498% of renters already pay >50% of income on rent) — very limited rent-growth headroom before tenants either downsize or default.
Questions for listing agent
- What do current leases actually rent for vs. the listed asking? Can we see a recent rent roll and the last 12 months of T-12 income?
- It's been on market 45 days. Have you received any prior offers? Is the seller open to a 33% concession, seller financing, or rate buy-down credit?
- Is there a deadline driving the sale (1031 exchange, divorce, estate, relocation)? That informs how much negotiation room exists.
- The area grade is low — what's the realistic commute time and amenity access for the typical tenant pool here? Any planned neighborhood developments (good or bad) we should know about?
- What's the average days-on-market for RENTAL listings here right now (not sales)? A rising rental-DOM trend means longer vacancies and softer asking-rent achievability than the comps imply.
- What's the recent tenant-quality profile in this submarket — average credit score on applications, eviction rate, late-payment / NSF rate, and stable-employment percentage? A property-management company in the area should have these aggregated.
- How much new for-sale + rental construction is in the pipeline within 1–3 miles? Heavy new supply typically softens prices + rents 12–24 months out; constrained supply supports both.
CashFlowRE · CFR-0N10576YYE0S29
· Data 1 day ago
cashflowre.app · 2026-05-29