70900 Jasmine Ln · Rancho Mirage, CA
Flood risk 1/10 · Minimal
- FEMA flood zone
- X (unshaded)
- Chance of flooding over 30 yrs
- 0.0%
- Est. flood insurance / yr
- $507 – $1,088
Fire risk 1/10 · Minimal
- Est. fire insurance / yr
- $659 – $1,223
Heat risk 9/10 · Severe
- Hot days now (above 114°F)
- 7 days/yr
- Hot days in 30 yrs
- 20 days/yr
Wind risk 1/10 · Minimal
- Chance of severe wind over 30 yrs
- —
Air-quality risk 4/10 · Minor
- Unhealthy air days now
- 5 days/yr
- Unhealthy air days in 30 yrs
- 7 days/yr
Risk factors via First Street. Map © Google.
Why this score? — see what drove the F grade
The composite is a weighted blend of 9 inputs, each scored 0–100. Each bar is that input's sub-score; the figure is the points it added to the 100-point composite (weight × sub-score).
- ARV discount +10.7/15.0
- Cash flow +7.8/30.0
- Rent growth +3.4/5.0
- Schools +2.7/10.0
- Livability +2.6/5.0
- Condition / age +2.5/5.0
- DSCR +1.9/10.0
- 1% rule +1.7/10.0
- Appreciation +0.0/10.0
$950,000
🖨 Deal sheet (PDF) 📄 Offer letter ✓ Due diligence
Listing remarks MLS
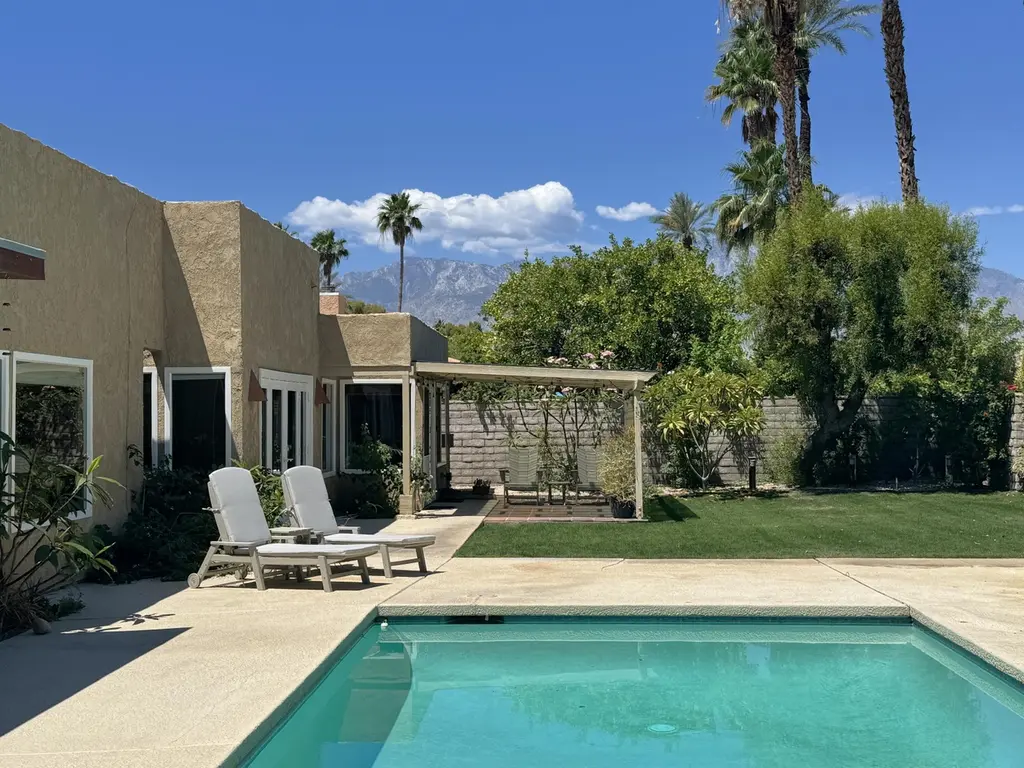
This contemporary residence is in an excellent location surrounded by communities of multi-million dollar homes. Enjoy a quiet street, between Mission Hills CC and Tamarisk CC, in an entertainer's versatile home with unique form and design.
Key facts
- Backyard tiki bar
- Central location
- Private pool and spa
Tags
Property features AI
Finance
- Other: Listing accepts Conventional, Cash to New Loan, and Cash; Possession at close of escrow; Not available for short-term rentals; will not consider lease
- HOA & community: No monthly association fee
Exterior
- Parking: Attached garage; Garage door opener; Approximately 2.5 garage spaces; 2 covered spaces; 2 uncovered/assigned spaces; Total of about 6.5 parking spaces
- Security: Security/safety features (other)
- Utilities: Sewer: connected and paid; No PUD
- Home design: Detached single-family residence; Single-story (ground level, no unit above); Front door faces south; leisure area faces north
- Construction: Year built (per assessor); Fee simple land
- Exterior features: Private, in-ground pool; Private in-ground spa/hot tub; Sprinkler system; Front yard with landscaping and lawn; Level lot
Interior
- Kitchen: Gas cooktop; Gas oven; Gas range; Microwave oven; Dishwasher; Disposal; Refrigerator; Ice maker; Exhaust fan; Water filter
- Flooring: Ceramic tile; Vinyl; Laminate; Other
- Bathrooms: One full bathroom; Two 3/4 bathrooms
- Heating & cooling: Central heating; Central air conditioning; Dual cooling
- Interior features: Ground-level entry with no steps; Unfurnished; Family room; Living room; Gas fireplace (1) located in family room and living room
- Laundry & utility: Washer; Dryer
Neighborhood map
What this means for you Summary
Snapshot
- This is a 4-bed/2.5-bath single-family listed at $950k.
Deal economics
- At list price, monthly cash flow is $-1k ($-13k/yr) — negative.
- To cash-flow at today's rent, offer at most $762k (19.8% below list).
- To meet the 1% rule (rent ≥ 1% of price), the offer needs to be $640k (32.6% below list).
- Recommended offer: $640k (32.6% below list) — sets the bar for 1% rule.
- Cap rate 4.9% vs local median 3.0% in Rancho Mirage — top-decile yield for the area; either an underpriced asset or a hidden risk that comps aren't pricing in. Stress-test before assuming the spread holds.
Location & tenants
- Location reads 51/100 on livability (#1,065 in CA) — a working-class tenant base; expect higher turnover. Strengths: employment A+; Watch: amenities F, commute F, cost of living F.
- Palm Springs Unified (suburban): math 21% / reading 42% proficiency, ranked #328 of 517 in CA (top 63%) — families likely to look elsewhere, expect single-tenant / working-renter base with shorter leases; 73% free/reduced lunch — lower-income household profile, screen leases tightly.
- Zoned schools: Rancho Mirage Elementary (309 students, 86% FRL); Nellie N. Coffman Middle (953 students, 98% FRL); Rancho Mirage High (math 15% / reading 38%, grade F, #804 of 1,170 statewide, top 69%, 1,491 students, 97% FRL) — zoned schools average 94% FRL vs 73% district-wide (20 pts higher); higher-poverty schools than district average — tighter screening recommended.
- Market conditions: Rents rising (+3.7%/yr); 532 active listings in the ZIP; 40 comparable units currently listed for rent nearby; rentals lingering (median 46d on market — plan ~5-8 weeks vacancy on turnover, expect pricing pressure); 60% of comp listings sitting > 30 days — soft ceiling on asking rent; solid renter incomes; 9,195 units permitted in Riverside County in 2024 (1,512 in 5+ unit buildings).
- At $6,404/mo this rent would consume 72% of the median local household income ($107k/yr) (locally 498% of renters already pay >50% of income on rent) — very limited rent-growth headroom before tenants either downsize or default.
Forward outlook
- Local home prices are declining (-3.0%/yr); year-one equity from $7k of loan paydown is wiped out by about $28k of value loss. Plan a longer hold.
- Riverside County population projected at +22% by 2050 — long-run rental-demand tailwind backs the buy-and-hold thesis.
Negotiation context
- It's been on market 45 days — a 3% lower offer ($922k) is reasonable based on typical stale-listing flexibility.
- 2 sale attempts since 7y ago; this cycle's ask is 6% above the opening price — seller raised mid-cycle; expect resistance to lowballs.
- Current owner paid $607k; list at $950k implies a 56% gain — meaningful room to come down on a strong offer.
Risks & watch-outs
- Climate carrying-cost: extreme-heat days projected 7→20/yr by 2055 (HVAC capex compounding) — expect insurance premiums to compound above CPI over the hold.
Questions for the listing agent
- What do current leases actually rent for vs. the listed asking? Can we see a recent rent roll and the last 12 months of T-12 income?
- It's been on market 45 days. Have you received any prior offers? Is the seller open to a 33% concession, seller financing, or rate buy-down credit?
- Is there a deadline driving the sale (1031 exchange, divorce, estate, relocation)? That informs how much negotiation room exists.
- The area grade is low — what's the realistic commute time and amenity access for the typical tenant pool here? Any planned neighborhood developments (good or bad) we should know about?
- What's the average days-on-market for RENTAL listings here right now (not sales)? A rising rental-DOM trend means longer vacancies and softer asking-rent achievability than the comps imply.
- What's the recent tenant-quality profile in this submarket — average credit score on applications, eviction rate, late-payment / NSF rate, and stable-employment percentage? A property-management company in the area should have these aggregated.
- How much new for-sale + rental construction is in the pipeline within 1–3 miles? Heavy new supply typically softens prices + rents 12–24 months out; constrained supply supports both.
Investment metrics
- 1% rule
- 0.67% ✗
- Cap rate
- 4.95%
- Cash-on-cash
- -4.80%
- DSCR
- 0.79
- GRM
- 12.4
CMA / ARV
- ARV (median comp)
- $1,021,698
- List price
- $950,000
- Delta
- -7.02%
- Verdict
- FAIR
- Comps
- 20 within 1.0 mi
Show comp detail 12 sales within ~0.75 mi
| Address | Dist | Beds/Ba | Sqft | Sold | Price | $/sf | Match |
|---|---|---|---|---|---|---|---|
| 54 San Fernando | 0.22mi | 3/2.5 (-1) | 2,598 (+2%) | 1mo | $995,000 | $383 | 80 |
| 70840 Ironwood Dr | 0.05mi | 3/3.5 (-1) | 2,644 (+4%) | 9mo | $1,160,000 | $439 | 74 |
| 9 San Marino Cir | 0.27mi | 3/2.0 (-1) | 2,308 (-9%) | 1mo | $740,000 | $321 | 65 |
| 70920 Ironwood Dr | 0.04mi | 4/3.0 | 2,160 (-15%) | 9mo | $870,000 | $403 | 64 |
| 11 Sterling Pl | 0.54mi | 3/3.0 (-1) | 2,498 (-2%) | 3mo | $1,568,000 | $628 | 63 |
| 36720 Palm Ct | 0.72mi | 4/2.5 | 2,537 (-0%) | 8mo | $1,225,000 | $483 | 59 |
| 45 Lincoln Pl | 0.74mi | 3/2.5 (-1) | 2,530 (-0%) | 5mo | $650,000 | $257 | 56 |
| 40 Lincoln Pl | 0.69mi | 3/2.5 (-1) | 2,550 (+0%) | 10mo | $955,000 | $375 | 54 |
| 16 Lincoln Pl | 0.68mi | 3/3.5 (-1) | 2,530 (-0%) | 7mo | $790,000 | $312 | 53 |
| 34 Lincoln Pl | 0.72mi | 3/2.5 (-1) | 2,628 (+4%) | 5mo | $1,435,000 | $546 | 52 |
| 37035 Carolyn Ct | 0.52mi | 3/3.0 (-1) | 2,280 (-10%) | 8mo | $1,628,100 | $714 | 45 |
| 70320 Mottle Cir | 0.70mi | 3/2.0 (-1) | 2,208 (-13%) | 2mo | $1,450,000 | $657 | 36 |
Match score weights: distance 35% · size 25% · config 20% · recency 20%. Top-matched comps best support the ARV.
Projected returns pro-forma
-3.0% appreciation · 3.72% rent growth · sell at horizon
- IRR
- -23.7%
- Equity multiple
- 0.18×
- Total profit
- $-217,178
- Equity at exit
- $141,648
- IRR
- -17.1%
- Equity multiple
- 0.03×
- Total profit
- $-257,589
- Equity at exit
- $82,139
Cash invested: $266,000 (down + closing). Projections, not guarantees.
Landlord ↔ Tenant lean methodology
- Overall (STATE)
- 18 Strongly Tenant-Friendly
- State California
- 18 Strongly Tenant-Friendly · D+13
- County
- — inherits STATE
- City
- — inherits STATE
ZIP-level market 92270
- Rents YoY
- 3.7%
- Active inventory
- 532
- Price-to-rent
- 12.4×
Monthly cashflow live
- Estimated rent
- $6,404 high interval (Pro) →
- Mortgage (P&I)
- −$4,982
- Tax from tax record
- −$745 /mo · $8,943/yr
- Insurance
- −$396
- HOA
- −$0
- Vacancy / Maint / Mgmt
- −$1,345
- Net cashflow
- $-1,064
Break-even live
Sensitivity live
| Price | -10% $-526 | -5% $-795 | +0% $-1,064 | +5% $-1,332 | +10% $-1,601 |
|---|---|---|---|---|---|
| Rent | -10% $-1,569 | -5% $-1,316 | +0% $-1,064 | +5% $-811 | +10% $-558 |
| Rate | -1.0pp $-585 | -0.5pp $-822 | base $-1,064 | +0.5pp $-1,310 | +1.0pp $-1,560 |
UW: 25.0% down · 7.5% · 30yr · 1.5% tax · 5.0% vac · 8.0% maint · 8.0% mgmt
Financing live
Cash to close
- Down payment
- $237,500
- Closing costs
- $28,500
- Reserves months
- —
- Total cash needed
- —
Loan-product check · same deal, 3 products live
Conventional
25% down · 7.5% · 30yr
- Down + closing
- —
- Monthly P&I
- —
- Monthly cashflow
- —
- DSCR
- —
- Eligible?
- —
Personal DTI + credit; lowest rate.
DSCR
20% down · 8.5% · 30yr
- Down + closing
- —
- Monthly P&I
- —
- Monthly cashflow
- —
- DSCR
- —
- Eligible?
- —
No personal income docs; deal must DSCR.
Hard money
10% down · 12.0% · 12mo
- Down + closing
- —
- Monthly P&I
- —
- Monthly cashflow
- —
- DSCR
- —
- Eligible?
- —
Short-term bridge; refi at stabilization.
Rent comps 40 comps
| Address | Beds | Baths | Sqft | Rent | $/sqft | DOM | Units | Dist |
|---|---|---|---|---|---|---|---|---|
| 36726 Jasmine Ln Rancho Mirage, CA | 4.0 | 3.0 | 2539 | $14,000 | $5.51 | 45d | 1 | 0.07mi |
| 70895 Ironwood Dr Rancho Mirage, CA | 4.0 | 2.5 | 2575 | $7,995 | $3.10 | 7d | 1 | 0.08mi |
| 70955 Sunny Ln Rancho Mirage, CA | 4.0 | 4.5 | 3623 | $17,500 | $4.83 | 45d | 1 | 0.14mi |
| 69 San Marino Cir Rancho Mirage, CA | 3.0 | 2.5 | 2601 | $3,795 | $1.46 | 24d | 1 | 0.26mi |
| 829 Inverness Dr Rancho Mirage, CA | 4.0 | 3.0 | 2527 | $11,000 | $4.35 | 14d | 1 | 0.41mi |
| 22 San Leandro Ct Rancho Mirage, CA | 3.0 | 3.5 | 2563 | $5,500 | $2.15 | 45d | 1 | 0.52mi |
| 70451 Cobb Rd Rancho Mirage, CA | 3.0 | 2.0 | 2148 | $3,750 | $1.75 | 45d | 1 | 0.59mi |
| 913 Inverness Dr Rancho Mirage, CA | 3.0 | 3.0 | 2690 | $6,800 | $2.53 | 45d | 1 | 0.62mi |
| 20 Lincoln Pl Rancho Mirage, CA | 3.0 | 3.5 | 2700 | $3,995 | $1.48 | 45d | 1 | 0.69mi |
| 41 Lincoln Pl Rancho Mirage, CA | 3.0 | 3.0 | 2272 | $4,900 | $2.16 | 45d | 1 | 0.74mi |
| 714 Inverness Dr Rancho Mirage, CA | 3.0 | 3.0 | 2227 | $3,500 | $1.57 | 45d | 1 | 0.76mi |
| 22 Calle Escala Rancho Mirage, CA | 3.0 | 2.5 | 2116 | $3,800 | $1.80 | 13d | 1 | 0.81mi |
| 1 Mayfair Dr Rancho Mirage, CA | 3.0 | 3.0 | 3306 | $15,000 | $4.54 | 45d | 1 | 0.81mi |
| 35018 Mission Hills Dr Rancho Mirage, CA | 3.0 | 3.0 | 3066 | $7,500 | $2.45 | 18d | 1 | 0.81mi |
| 35018 Mission Hills Dr Rancho Mirage, CA | 3.0 | 3.0 | 3066 | $7,500 | $2.45 | 45d | 1 | 0.81mi |
| 37641 Peacock Cir Rancho Mirage, CA | 3.0 | 3.0 | 2395 | $6,500 | $2.71 | 26d | 1 | 0.81mi |
| 70181 Chappel Rd Rancho Mirage, CA | 4.0 | 3.0 | 2000 | $5,900 | $2.95 | 45d | 1 | 0.85mi |
| 140 Columbia Dr Rancho Mirage, CA | 3.0 | 3.0 | 2950 | $8,950 | $3.03 | 45d | 1 | 0.85mi |
| 4 Bentley Rd Rancho Mirage, CA | 4.0 | 2.5 | 3068 | $6,500 | $2.12 | 45d | 1 | 0.88mi |
| 5 Victoria Falls Dr Rancho Mirage, CA | 4.0 | 4.0 | 3427 | $4,500 | $1.31 | 26d | 1 | 0.95mi |
| 464 Sunningdale Dr Rancho Mirage, CA | 3.0 | 3.0 | 1751 | $6,000 | $3.43 | 45d | 1 | 1.01mi |
| 507 Desert West Dr Rancho Mirage, CA | 3.0 | 2.0 | 2265 | $8,500 | $3.75 | 45d | 1 | 1.03mi |
| 13 Vista Mirage Way Rancho Mirage, CA | 3.0 | 2.0 | 2071 | $3,700 | $1.79 | 46d | 1 | 1.03mi |
| 42 Colonial Dr Rancho Mirage, CA | 3.0 | 3.0 | 2005 | $3,600 | $1.80 | 5d | 1 | 1.05mi |
| 42 Colonial Dr Rancho Mirage, CA | 3.0 | 3.0 | 2005 | $3,600 | $1.80 | 24d | 1 | 1.05mi |
| 13 Tennis Club Dr Rancho Mirage, CA | 3.0 | 3.0 | 2079 | $4,500 | $2.16 | 18d | 1 | 1.06mi |
| 5 Chandra Ln Rancho Mirage, CA | 3.0 | 2.0 | 2015 | $4,000 | $1.99 | 45d | 1 | 1.06mi |
| 23 Tennis Club Dr Rancho Mirage, CA | 3.0 | 2.0 | 1899 | $3,600 | $1.90 | 26d | 1 | 1.07mi |
| 37640 Los Cocos Dr E Rancho Mirage, CA | 3.0 | 2.5 | 2275 | $3,000 | $1.32 | 26d | 1 | 1.07mi |
| 25 Buckingham Way Rancho Mirage, CA | 5.0 | 3.5 | 3332 | $5,800 | $1.74 | 18d | 1 | 1.10mi |
| 69940 Los Cocos Ct Rancho Mirage, CA | 3.0 | 3.0 | 2367 | $2,900 | $1.23 | 45d | 1 | 1.11mi |
| 30 Tennis Club Dr Rancho Mirage, CA | 3.0 | 2.0 | 1920 | $3,500 | $1.82 | 5d | 1 | 1.11mi |
| 1 Briarcliff Ct Rancho Mirage, CA | 3.0 | 3.0 | 2694 | $9,500 | $3.53 | 45d | 1 | 1.13mi |
| 65 La Costa Dr Rancho Mirage, CA | 4.0 | 3.0 | 2736 | $10,500 | $3.84 | 45d | 1 | 1.14mi |
| 5 Briarcliff Ct Rancho Mirage, CA | 3.0 | 3.0 | 2950 | $5,500 | $1.86 | 45d | 1 | 1.15mi |
| 52 Princeton Dr Rancho Mirage, CA | 3.0 | 3.0 | 3088 | $10,500 | $3.40 | 26d | 1 | 1.16mi |
| 6 Exeter Ct Rancho Mirage, CA | 3.0 | 3.0 | 3288 | $14,000 | $4.26 | 26d | 1 | 1.21mi |
| 645 Hospitality Dr Rancho Mirage, CA | 3.0 | 3.0 | 2727 | $4,300 | $1.58 | 45d | 1 | 1.22mi |
| 23 Duke Dr Unit 23 Rancho Mirage, CA | 3.0 | 3.0 | 3080 | $7,500 | $2.44 | 45d | 1 | 1.23mi |
| 8 Tulane Ct Rancho Mirage, CA | 3.0 | 3.0 | 2950 | $5,000 | $1.69 | 45d | 1 | 1.24mi |
Listing history 23 events
-
2026-06-21days on market $950,000 Active 45 DOM
-
2026-06-18days on market $950,000 Active 42 DOM
-
2026-06-17days on market $950,000 Active 41 DOM
-
2026-06-16days on market $950,000 Active 40 DOM
-
2026-06-15price $950,000 Active 39 DOM
-
2026-06-15days on market $900,000 Active 39 DOM
-
2026-06-13days on market $900,000 Active 37 DOM
-
2026-06-13days on market $900,000 Active 36 DOM
-
2026-06-09days on market $900,000 Active 33 DOM
-
2026-06-08days on market $900,000 Active 32 DOM
-
2026-06-07days on market $900,000 Active 31 DOM
-
2026-06-04days on market $900,000 Active 28 DOM
-
2026-06-03days on market $900,000 Active 27 DOM
-
2026-06-02days on market $900,000 Active 26 DOM
-
2026-06-01days on market $900,000 Active 25 DOM
-
2026-05-31days on market $900,000 Active 24 DOM
-
2026-05-07$900,000 Active 2093-char remark
-
2020-03-25soldstatus $607,140 Closed 240-char remark
Show marketing remark (240 chars)
This contemporary residence is in an excellent location surrounded by communities of multi-million dollar homes. Enjoy a quiet street, between Mission Hills CC and Tamarisk CC, in an entertainer's versatile home with unique form and design.
-
2020-03-25soldstatus $607,500
Show marketing remark (240 chars)
This contemporary residence is in an excellent location surrounded by communities of multi-million dollar homes. Enjoy a quiet street, between Mission Hills CC and Tamarisk CC, in an entertainer's versatile home with unique form and design.
-
2020-03-09status Pending 240-char remark
Show marketing remark (240 chars)
This contemporary residence is in an excellent location surrounded by communities of multi-million dollar homes. Enjoy a quiet street, between Mission Hills CC and Tamarisk CC, in an entertainer's versatile home with unique form and design.
-
2020-01-11price $635,000 240-char remark
Show marketing remark (240 chars)
This contemporary residence is in an excellent location surrounded by communities of multi-million dollar homes. Enjoy a quiet street, between Mission Hills CC and Tamarisk CC, in an entertainer's versatile home with unique form and design.
-
2019-11-04$649,500 Active 240-char remark
Show marketing remark (240 chars)
This contemporary residence is in an excellent location surrounded by communities of multi-million dollar homes. Enjoy a quiet street, between Mission Hills CC and Tamarisk CC, in an entertainer's versatile home with unique form and design.
-
1991-11-19soldstatus $250,000
ⓘ Source: listings_history table (triggers on properties + properties_extension) + one-shot
backfill from property_details.listing_events for pre-trigger history.
Tax reassessment forecast CA · Resets to sale price
- Current annual tax
- $8,943 · $745/mo
- Projected year-2 tax
- $8,943 · $745/mo
- Expected delta
- $0/yr ($0/mo · 0.0%)
ⓘ Screening estimate from a state-policy table — verify with the county assessor before closing.
Climate risk First Street
- Flood 1/10 Low FEMA zone X (unshaded) · 0% chance over 30 yrs
- Wildfire 1/10 Low
- Heat 9/10 Extreme 7 d/yr ≥114°F today · 20 d/yr by 30 yrs out
- Wind 1/10 Low
- Air quality 4/10 Moderate 5 unhealthy d/yr today · 7 by 30 yrs out
Nearby sold comps map
Loading sold comps map…
Walkable amenities ~0.75 mi
Loading nearby amenities…
Taxation est. · year 1
- Rental income
- $76,853
- − Mortgage interest
- −$53,215
- − Property taxes
- −$8,943
- − Insurance
- −$4,750
- − Repairs & maintenance
- −$6,148
- − Management
- −$6,148
- − Depreciation
- −$27,636
- Taxable loss
- −$29,988
- Est. tax savings @ 24.0%
- +$7,197
- After-tax cash flow
- $-5,565/yr
For passive investors: Depreciation is non-cash, so a rental often shows a tax loss while cash-flowing — sheltering income. Rental losses are passive: they offset passive income freely, and up to $25,000/yr can offset ordinary (W-2) income if you actively participate and your MAGI is under $100k (phasing out to $0 by $150k); unused losses carry forward. On sale, claimed depreciation is recaptured at up to 25%, and gains may owe capital-gains tax (a 1031 exchange can defer both). Figures are a year-1 estimate at your 24.0% rate — not tax advice; consult a CPA.
Schools (NCES district)
- District
- Palm Springs Unified
- NCES district ID
- 0629550
- Math proficiency
- 21% ▼ -7.00%
- Reading proficiency
- 42% ▬ 0.00%
- Median HH income
- $43,638
- Composite
- 26.76/100
- National rank
- #7131
- State rank
- #328 of 517 in CA
Livability — Rancho Mirage
- Score
- 51/100
- State rank
- #1065
- US rank
- #25255
Category grades
Schools grade is shown separately in the Schools card above.
Census & demographics
- Census place
- Rancho Mirage, CA
- County
- Riverside County · 2,287,001 people
- City population
- 17,563
- Metro
- Riverside-San Bernardino-Ontario, CA
- Population (ZIP)
- 17,563
- Household income
- $107,364
- Rent vs Own
- Severe rent burden
- 498.0
Population outlook (Riverside County) Hauer SSP2
- Today (2025)
- 2,664,475 people
- By 2030
- 2,802,692 · +5.2%
- By 2040
- 3,050,904 · +14.5%
- By 2050
- 3,256,783 · +22.2%
- By 2075
- 3,655,058 · +37.2%
- By 2100
- 3,766,594 · +41.4%
Race, ethnicity, and origin ACS 2023
- Neighborhood character
- Predominantly White (77%)
- Race & ethnicity
- White 77% Hispanic / Latino 15% Two or more races 6% Asian 4% Black 2%
- Hispanic origin (detail)
- Mexican 12%
- Common ancestry
- Slovak 4% Romanian 3% Lithuanian 3%
- Foreign-born
- 17% · Canada, South Korea, China
- Languages at home
- 81% English-only · Spanish 11% Other Indo-European 3% French/Haitian/Cajun 1%
Political lean MEDSL · Riverside
- 2024 margin
- Toss-up / Even · D 48.0% · R 49.3% · Other 2.6%
- 2008→2024 swing
- -3.6pp toward R · 2008: 2.3pp · 2024: -1.3pp
- All cycles
- 2024: R+1.3 2020: D+8.0 2016: D+4.3 2012: R+0.4 2008: D+2.3
Not yet ingested
- Civics
- —
Market trends
- HPI YoY
- ▼ -210.99%
- Current HPI
- 282.2957
- Rent YoY
- ▲ 3.72%
- Metro
- Riverside-San Bernardino-Ontario, CA
- State GDP YoY
- ▲ 3.21%
- F500 in state
- 116
Industry mix (Fortune 500 HQ in CA)
| Industry | F500 HQs | Revenue |
|---|---|---|
| Technology | 27 | $1,492B |
|
||
| Financial Services | 3 | $174B |
|
||
| Retail | 3 | $44B |
|
||
| Insurance | 3 | $26B |
|
||
| Media / Entertainment | 2 | $115B |
|
||
| Pharmaceuticals / Biotech | 2 | $62B |
|
||
Price history
+280.0% since first listed8 events — show timeline
- 2026-06-15 Price Changed $950,000 GPSMLS
- 2026-05-07 Listed $900,000 GPSMLS
- 2020-03-25 Sold (Public Records) $607,500 Public Records
- 2020-03-25 Sold (MLS) $607,140 GPSMLS
- 2020-03-09 Pending — GPSMLS
- 2020-01-11 Price Changed $635,000 GPSMLS
- 2019-11-04 Listed $649,500 GPSMLS
- 1991-11-19 Sold (Public Records) $250,000 Public Records
Property tax history
+4.4%/yrLatest (2025): $8,943 · -1.1% YoY. Source: county tax records.
Cash-flow waterfall
monthlySold comps — $/sqft
last 12 mo · ≤1 miLoading sold comps…