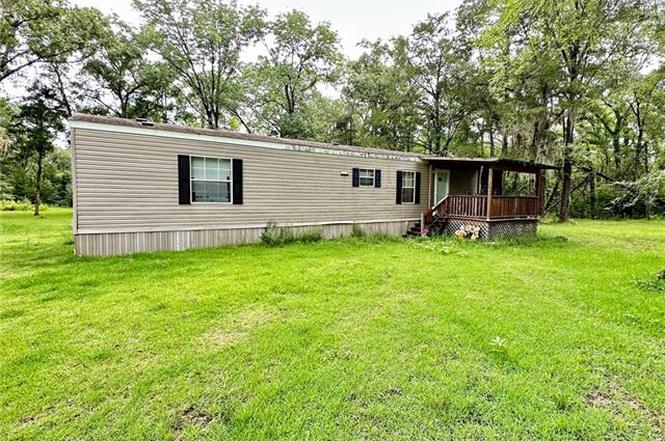
774 Claudes Rd
Colfax, LA 71417
$89,500C-
2 bd · 2.0 ba ·
840 sqft ·
Built 2011
· Manufactured
· Active
· 1 DOM
Cashflow @ list (25.0% down · 7.5%)
Estimated rent
$848/mo
Mortgage (P&I)
−$469
Tax + insurance
−$274
HOA
−$0
Vac / Maint / Mgmt
−$178
Net cashflow
$-74/mo
Annual
$-889/yr
Cap rate
6.98%
Cash-on-cash
2.45%
DSCR
1.11
1% rule
0.95%
Cash to close
$25,060
Investor read
- This is a 2-bed/2.0-bath manufactured listed at $90k.
- At list price, monthly cash flow is $-74 ($-889/yr) — negative.
- To cash-flow at today's rent, offer at most $79k (12.0% below list).
- To meet the 1% rule (rent ≥ 1% of price), the offer needs to be $85k (5.3% below list).
- Only 1 days on market — expect competitive offers; lowballing is unlikely to land.
- Recommended offer: $79k (12.0% below list) — sets the bar for cash-flow.
- In year one you build about $6k of equity ($619 loan paydown + $5k appreciation (6.0% local appreciation)).
- Location reads 66/100 on livability (#122 in LA) — a middle-class / working-renter tenant base. Strengths: cost of living A+, health & safety A+, housing B+; Watch: amenities F, commute F, employment F.
- Grant Parish (rural): math 27% / reading 34% proficiency, ranked #43 of 98 in LA (top 44%) — families likely to look elsewhere, expect single-tenant / working-renter base with shorter leases.
- Zoned schools: Colfax Elementary School (math 2% / reading 8%, grade F, #633 of 646 statewide, top 99%, 126 students, 88% FRL); Grant Junior High School (math 29% / reading 34%, grade F, #108 of 218 statewide, top 50%, 504 students, 73% FRL); Montgomery High School (math 27% / reading 37%, grade F, #118 of 265 statewide, top 46%, 249 students, 78% FRL) — zoned schools average 79% FRL vs 59% district-wide (20 pts higher); higher-poverty schools than district average — tighter screening recommended.
- Watch-outs: flood insurance adds $125/mo.
- Market conditions: 24 active listings in the ZIP; 5 units permitted in Grant Parish in 2024 (0 in 5+ unit buildings).
- Grant County population projected to shrink 4% by 2050 — rents likely to lag national; underwrite the cash flow, not the appreciation.
- 3 sale attempts since 10y ago with the ask held roughly flat each time — persistent listings suggest the price (not the market) is what's stuck; bring a comps-based counter.
- At projected returns (6.0% appreciation + 3.0% rent growth), your $25k cash investment doubles in ~5 years — after that, you're playing with house money.
- By year 6, paydown + projected appreciation supports a ~$32k cash-out refi (75% LTV) — recoverable capital for the next deal without selling this one.
- Climate carrying-cost: in FEMA flood zone A (mandatory federal flood insurance); severe wind risk, 80% chance of damaging wind over 30y; moderate wildfire risk; extreme-heat days projected 7→20/yr by 2055 (HVAC capex compounding) — expect insurance premiums to compound above CPI over the hold.
Questions for listing agent
- What do current leases actually rent for vs. the listed asking? Can we see a recent rent roll and the last 12 months of T-12 income?
- What's the actual annual flood-insurance premium (NFIP or private), and is the property in a SFHA with mandatory coverage?
- Is there a deadline driving the sale (1031 exchange, divorce, estate, relocation)? That informs how much negotiation room exists.
- Schools are F-rated, which usually means shorter tenancies and higher turnover. Who's the typical renter profile here, and what's been the actual vacancy rate?
- This sits on a lake — are riparian / water-frontage rights deeded with the parcel? Any dock permits, shoreline easements, or HOA water-use restrictions?
- What's the documented flood / surge / shoreline-erosion history here (FEMA AND non-FEMA — e.g., storm surge, creek backup, septic-field saturation)?
- Any water-quality or seasonal algae-bloom issues that affect tenant satisfaction or short-term-rental demand?
- What's the average days-on-market for RENTAL listings here right now (not sales)? A rising rental-DOM trend means longer vacancies and softer asking-rent achievability than the comps imply.
CashFlowRE · CFR-0NESSQ6Q9R8Q94
· Data 3 days ago
cashflowre.app · 2026-05-29