 🌊 Lakefront
774 Claudes Rd · Colfax, LA
Flood risk 4/10 · Minor
- FEMA flood zone
- A
- Chance of flooding over 30 yrs
- 0.22%
- Est. flood insurance / yr
- $1,009 – $1,996
Fire risk 5/10 · Moderate
- Est. fire insurance / yr
- $1,269 – $2,357
Heat risk 7/10 · Major
- Hot days now (above 111°F)
- 7 days/yr
- Hot days in 30 yrs
- 20 days/yr
Wind risk 8/10 · Major
- Chance of severe wind over 30 yrs
- 80.0%
Air-quality risk 1/10 · Minimal
- Unhealthy air days now
- 0 days/yr
- Unhealthy air days in 30 yrs
- 0 days/yr
Risk factors via First Street. Map © Google.
Why this score? — see what drove the C- grade
The composite is a weighted blend of 9 inputs, each scored 0–100. Each bar is that input's sub-score; the figure is the points it added to the 100-point composite (weight × sub-score).
- Cash flow +16.4/30.0
- Appreciation +8.0/10.0
- ARV discount +7.5/15.0
- DSCR +5.1/10.0
- 1% rule +4.5/10.0
- Livability +3.3/5.0
- Schools +2.6/10.0
- Rent growth +2.5/5.0
- Condition / age +2.5/5.0
$89,500
🖨 Deal sheet (PDF) 📄 Offer letter ✓ Due diligence
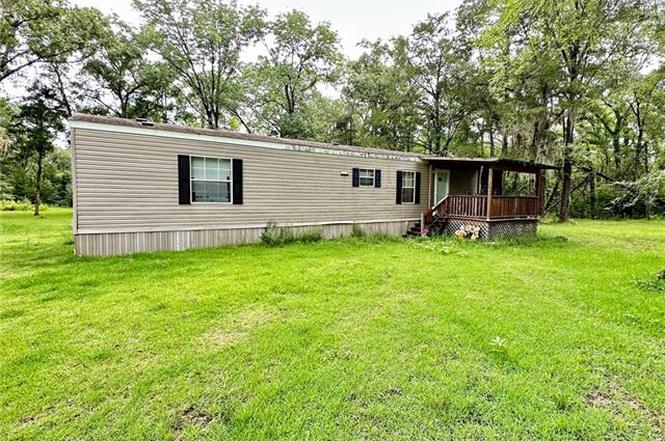
Listing remarks
Discover 7.5 picturesque acres on the shores of Iatt Lake, featuring over 400 feet of waterfront lined with mature cypress and hardwood trees. This peaceful property includes a well-maintained 2011 manufactured home offering 2 bedrooms, 2 bathrooms, and approximately 816 heated square feet--perfect for a weekend getaway or comfortable full-time living. With ample space to expand, this property is a true outdoor enthusiast's dream. Enjoy fishing and duck hunting right from your own backyard, or create the retreat you've always envisioned.
Key facts
- 7.5 acre lot
- Built 2011
Tags
Property features AI
Exterior
- Home design: Manufactured Home
- Construction: Vinyl siding; Composition roof
- Exterior features: Acreage
Interior
- Bathrooms: 2 full bathrooms
- Heating & cooling: Central heating; Central air conditioning
- Interior features: Bedroom 1; Dining Room; Living Room
Neighborhood map
What this means for you Summary
Snapshot
- This is a 2-bed/2.0-bath manufactured listed at $90k.
Deal economics
- At list price, monthly cash flow is $-74 ($-889/yr) — negative.
- To cash-flow at today's rent, offer at most $79k (12.0% below list).
- To meet the 1% rule (rent ≥ 1% of price), the offer needs to be $85k (5.3% below list).
- Recommended offer: $79k (12.0% below list) — sets the bar for cash-flow.
Location & tenants
- Location reads 66/100 on livability (#122 in LA) — a middle-class / working-renter tenant base. Strengths: cost of living A+, health & safety A+, housing B+; Watch: schools F, amenities F, commute F.
- Grant Parish (rural): math 27% / reading 34% proficiency, ranked #43 of 98 in LA (top 44%) — families likely to look elsewhere, expect single-tenant / working-renter base with shorter leases.
- Market conditions: 24 active listings in the ZIP; 5 units permitted in Grant Parish in 2024 (0 in 5+ unit buildings).
Forward outlook
- In year one you build about $6k of equity ($619 loan paydown + $5k appreciation (6.0% local appreciation)).
- Grant County population projected to shrink 4% by 2050 — rents likely to lag national; underwrite the cash flow, not the appreciation.
- At projected returns (6.0% appreciation + 3.0% rent growth), your $25k cash investment doubles in ~5 years — after that, you're playing with house money.
- By year 6, paydown + projected appreciation supports a ~$32k cash-out refi (75% LTV) — recoverable capital for the next deal without selling this one.
Negotiation context
- Only 1 days on market — expect competitive offers; lowballing is unlikely to land.
- 3 sale attempts since 10y ago with the ask held roughly flat each time — persistent listings suggest the price (not the market) is what's stuck; bring a comps-based counter.
Risks & watch-outs
- Watch-outs: flood insurance adds $125/mo.
- Climate carrying-cost: in FEMA flood zone A (mandatory federal flood insurance); severe wind risk, 80% chance of damaging wind over 30y; moderate wildfire risk; extreme-heat days projected 7→20/yr by 2055 (HVAC capex compounding) — expect insurance premiums to compound above CPI over the hold.
Questions for the listing agent
- What do current leases actually rent for vs. the listed asking? Can we see a recent rent roll and the last 12 months of T-12 income?
- What's the actual annual flood-insurance premium (NFIP or private), and is the property in a SFHA with mandatory coverage?
- Is there a deadline driving the sale (1031 exchange, divorce, estate, relocation)? That informs how much negotiation room exists.
- Schools are F-rated, which usually means shorter tenancies and higher turnover. Who's the typical renter profile here, and what's been the actual vacancy rate?
- This sits on a lake — are riparian / water-frontage rights deeded with the parcel? Any dock permits, shoreline easements, or HOA water-use restrictions?
- What's the documented flood / surge / shoreline-erosion history here (FEMA AND non-FEMA — e.g., storm surge, creek backup, septic-field saturation)?
- Any water-quality or seasonal algae-bloom issues that affect tenant satisfaction or short-term-rental demand?
- What's the average days-on-market for RENTAL listings here right now (not sales)? A rising rental-DOM trend means longer vacancies and softer asking-rent achievability than the comps imply.
- What's the recent tenant-quality profile in this submarket — average credit score on applications, eviction rate, late-payment / NSF rate, and stable-employment percentage? A property-management company in the area should have these aggregated.
- How much new for-sale + rental construction is in the pipeline within 1–3 miles? Heavy new supply typically softens prices + rents 12–24 months out; constrained supply supports both.
Investment metrics
- 1% rule
- 0.95% ✗
- Cap rate
- 6.98%
- Cash-on-cash
- 2.45%
- DSCR
- 1.11
- GRM
- 8.8
CMA / ARV
No comps found within radius.
Projected returns pro-forma
5.95% appreciation · 3.0% rent growth · sell at horizon
- IRR
- 12.4%
- Equity multiple
- 1.83×
- Total profit
- $20,923
- Equity at exit
- $55,956
- IRR
- 13.2%
- Equity multiple
- 3.61×
- Total profit
- $65,492
- Equity at exit
- $101,210
Cash invested: $25,060 (down + closing). Projections, not guarantees.
Landlord ↔ Tenant lean methodology
- Overall (STATE)
- 90 Strongly Landlord-Friendly
- State Louisiana
- 90 Strongly Landlord-Friendly · R+12
- County
- — inherits STATE
- City
- — inherits STATE
ZIP-level market 71417
- Home prices YoY
- 5.2%
- Active inventory
- 24
- Price-to-rent
- 8.8×
Monthly cashflow live
- Estimated rent
- $848 medium interval (Pro) →
- Mortgage (P&I)
- −$469
- Tax est. 1.5%
- −$112 /mo · $1,342/yr
- Insurance
- −$37
- Flood insurance flood zone
- −$125 /mo · $1,502/yr
- HOA
- −$0
- Vacancy / Maint / Mgmt
- −$178
- Net cashflow
- $-74
Break-even live
Sensitivity live
| Price | -10% $-12 | -5% $-43 | +0% $-74 | +5% $-105 | +10% $-136 |
|---|---|---|---|---|---|
| Rent | -10% $-141 | -5% $-108 | +0% $-74 | +5% $-41 | +10% $-7 |
| Rate | -1.0pp $-29 | -0.5pp $-51 | base $-74 | +0.5pp $-97 | +1.0pp $-121 |
UW: 25.0% down · 7.5% · 30yr · 1.5% tax · 5.0% vac · 8.0% maint · 8.0% mgmt
Financing live
Cash to close
- Down payment
- $22,375
- Closing costs
- $2,685
- Reserves months
- —
- Total cash needed
- —
Loan-product check · same deal, 3 products live
Conventional
25% down · 7.5% · 30yr
- Down + closing
- —
- Monthly P&I
- —
- Monthly cashflow
- —
- DSCR
- —
- Eligible?
- —
Personal DTI + credit; lowest rate.
DSCR
20% down · 8.5% · 30yr
- Down + closing
- —
- Monthly P&I
- —
- Monthly cashflow
- —
- DSCR
- —
- Eligible?
- —
No personal income docs; deal must DSCR.
Hard money
10% down · 12.0% · 12mo
- Down + closing
- —
- Monthly P&I
- —
- Monthly cashflow
- —
- DSCR
- —
- Eligible?
- —
Short-term bridge; refi at stabilization.
Listing history 2 events
-
2026-06-18remarks 543-char remark
-
2026-06-18$89,500 Active 1 DOM
ⓘ Source: listings_history table (triggers on properties + properties_extension) + one-shot
backfill from property_details.listing_events for pre-trigger history.
Climate risk First Street
- Flood 4/10 Moderate FEMA zone A · 22% chance over 30 yrs
- Wildfire 5/10 Major
- Heat 7/10 Severe 7 d/yr ≥111°F today · 20 d/yr by 30 yrs out
- Wind 8/10 Severe 80% chance of damaging wind over 30 yrs
- Air quality 1/10 Low 0 unhealthy d/yr today · 0 by 30 yrs out
Nearby sold comps map
Loading sold comps map…
Walkable amenities ~0.75 mi
Loading nearby amenities…
Taxation est. · year 1
- Rental income
- $10,172
- − Mortgage interest
- −$5,013
- − Property taxes
- −$1,342
- − Insurance
- −$1,950
- − Repairs & maintenance
- −$814
- − Management
- −$814
- − Depreciation
- −$2,604
- Taxable loss
- −$2,365
- Est. tax savings @ 24.0%
- +$568
- After-tax cash flow
- $-321/yr
For passive investors: Depreciation is non-cash, so a rental often shows a tax loss while cash-flowing — sheltering income. Rental losses are passive: they offset passive income freely, and up to $25,000/yr can offset ordinary (W-2) income if you actively participate and your MAGI is under $100k (phasing out to $0 by $150k); unused losses carry forward. On sale, claimed depreciation is recaptured at up to 25%, and gains may owe capital-gains tax (a 1031 exchange can defer both). Figures are a year-1 estimate at your 24.0% rate — not tax advice; consult a CPA.
Schools (NCES district)
- District
- Grant Parish
- NCES district ID
- 2200690
- Math proficiency
- 27% ▼ -41.00%
- Reading proficiency
- 34% ▼ -40.00%
- Median HH income
- $39,458
- Composite
- 25.59/100
- National rank
- #7420
- State rank
- #43 of 98 in LA
Livability — Colfax
- Score
- 66/100
- State rank
- #122
- US rank
- #11590
Category grades
Schools grade is shown separately in the Schools card above.
Census & demographics
- Population (ZIP)
- 4,681
Population outlook (Grant County) Hauer SSP2
- Today (2025)
- 22,478 people
- By 2030
- 22,656 · +0.8%
- By 2040
- 22,488 · +0.0%
- By 2050
- 21,631 · -3.8%
- By 2075
- 18,569 · -17.4%
- By 2100
- 14,621 · -35.0%
Race, ethnicity, and origin ACS 2023
- Neighborhood character
- Predominantly White (65%)
- Race & ethnicity
- White 65% Black 30% Two or more races 3% Asian 2% Hispanic / Latino 1%
- Common ancestry
- Lithuanian 4% Slovak 1% Serbian 1%
- Foreign-born
- 2% · South Korea, China
- Languages at home
- 97% English-only · Chinese 2% French/Haitian/Cajun 0%
Political lean MEDSL · Grant
- 2024 margin
- Solid R (+76.8) · D 11.0% · R 87.9% · Other 1.1%
- 2008→2024 swing
- -13.4pp toward R · 2008: -63.5pp · 2024: -76.8pp
- All cycles
- 2024: R+76.8 2020: R+74.1 2016: R+70.6 2012: R+65.3 2008: R+63.5
Not yet ingested
- Civics
- —
Market trends
- HPI YoY
- ▲ 5.95%
- Current HPI
- 120.0524
- Rent YoY
- —
- Metro
- —
- State GDP YoY
- ▲ 3.29%
- F500 in state
- 10
Industry mix (Fortune 500 HQ in LA)
| Industry | F500 HQs | Revenue |
|---|---|---|
| Telecommunications | 2 | $23B |
|
||
| Utilities | 1 | $12B |
|
||
| Wholesale / Distribution | 1 | $5B |
|
||
| Advertising | 1 | $2B |
|
||
Price history
-22.2% since first listed3 events — show timeline
- 2026-06-18 Listed $89,500 AcadianaMLS
- 2017-06-23 Listed $114,000 AcadianaMLS
- 2016-05-23 Listed $115,000 AcadianaMLS
Cash-flow waterfall
monthlySold comps — $/sqft
last 12 mo · ≤1 miLoading sold comps…