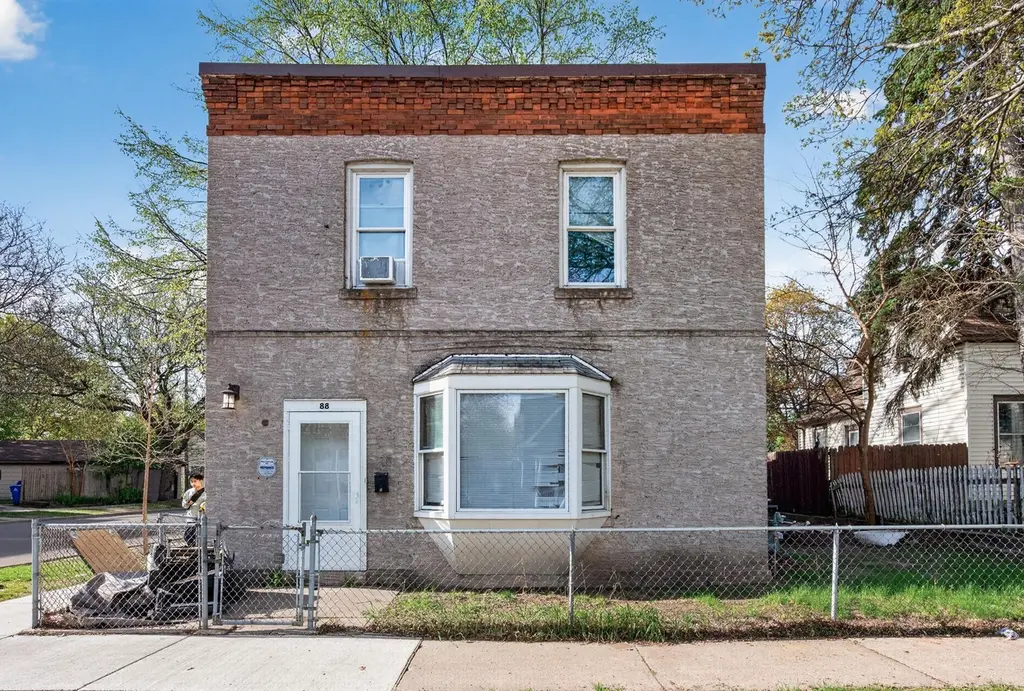
88 Cook Ave W
St. Paul, MN 55117
$265,000D
4 bd · 2.0 ba ·
1,656 sqft ·
Built 1908
· MultiFamily
· Active
· 37 DOM
Cashflow @ list (25.0% down · 7.5%)
Estimated rent
$2,711/mo
Mortgage (P&I)
−$1,390
Tax + insurance
−$611
HOA
−$0
Vac / Maint / Mgmt
−$569
Net cashflow
$141/mo
Annual
$1,689/yr
Cap rate
6.93%
Cash-on-cash
2.28%
DSCR
1.10
1% rule
1.02%
Cash to close
$74,200
Investor read
- This is a 2 × 2-bed/1.0-bath units multifamily listed at $265k.
- At list price, monthly cash flow is $141 ($2k/yr) — positive. Per door: $70/mo.
- The deal already cash-flows at list — no discount required.
- Meets the 1% rule at list price ($3k rent vs $265k).
- It's been on market 37 days — a 3% lower offer ($257k) is reasonable based on typical stale-listing flexibility.
- Recommended offer: $257k (3.0% below list) — sets the bar for market timing.
- Local home prices are declining (-3.0%/yr); year-one equity from $2k of loan paydown is wiped out by about $8k of value loss. Plan a longer hold.
- Location reads: area grade D — affects rentability + tenant quality, not the cash-flow math above.
- St. Paul Public School District (urban): math 21% / reading 33% proficiency, ranked #270 of 301 in MN (top 90%) — low school quality limits family demand, transient renter base, plan for 1-2y turnover; 64% free/reduced lunch — lower-income household profile, screen leases tightly.
- Zoned schools: Mississippi Creative Arts Elem (math 17% / reading 17%, grade F, #771 of 857 statewide, top 91%, 566 students, 94% FRL) — zoned schools average 94% FRL vs 64% district-wide (30 pts higher); higher-poverty schools than district average — tighter screening recommended.
- Watch-outs: built in 1908 — expect roof / HVAC / electrical / plumbing capex.
- Market conditions: Rents rising (+3.6%/yr); 175 active listings in the ZIP; 2 comparable units currently listed for rent nearby; 1,202 units permitted in Ramsey County in 2024 (880 in 5+ unit buildings).
- Ramsey County population projected at +27% by 2050 — long-run rental-demand tailwind backs the buy-and-hold thesis.
- 3 sale attempts since 27y ago; this cycle's ask has dropped $25k (9%) from the opening price — seller is motivated, your offer sets the floor, not the list.
- At $2,711/mo this rent would consume 46% of the median local household income ($71k/yr) (locally 1588% of renters already pay >50% of income on rent) — very limited rent-growth headroom before tenants either downsize or default.
Questions for listing agent
- It's been on market 37 days. Have you received any prior offers? Is the seller open to a 3% concession, seller financing, or rate buy-down credit?
- Can we see the unit-by-unit rent roll, current vacancy, and any below-market leases? What's the average tenancy length?
- What capital expenditures (roof, boiler, parking lot, exteriors) have been made in the last 5 years, and what's planned in the next 2?
- Built in 1908 — when were the roof, HVAC, electrical panel, plumbing, and water heater last replaced?
- Is there a deadline driving the sale (1031 exchange, divorce, estate, relocation)? That informs how much negotiation room exists.
- The area grade is low — what's the realistic commute time and amenity access for the typical tenant pool here? Any planned neighborhood developments (good or bad) we should know about?
- What's the average days-on-market for RENTAL listings here right now (not sales)? A rising rental-DOM trend means longer vacancies and softer asking-rent achievability than the comps imply.
- What's the recent tenant-quality profile in this submarket — average credit score on applications, eviction rate, late-payment / NSF rate, and stable-employment percentage? A property-management company in the area should have these aggregated.
CashFlowRE · CFR-0PHHBSAPNAR7M9
· Data 1 day ago
cashflowre.app · 2026-05-29