 Duplex
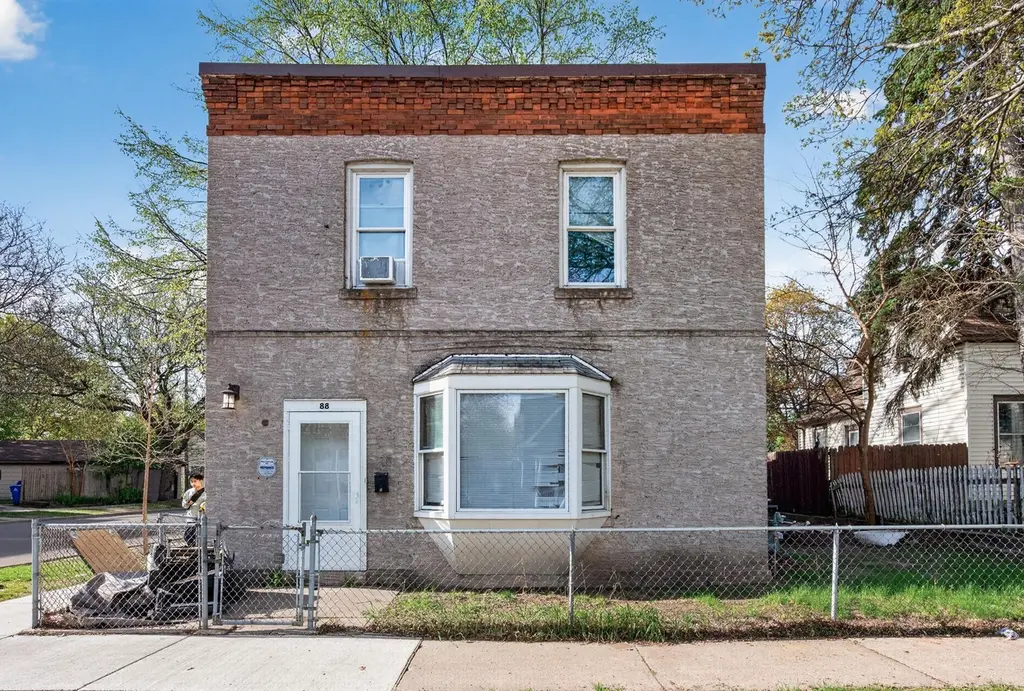
88 Cook Ave W · St. Paul, MN
Flood risk 1/10 · Minimal
- FEMA flood zone
- X (unshaded)
- Chance of flooding over 30 yrs
- 0.0%
- Est. flood insurance / yr
- $473 – $860
Fire risk 1/10 · Minimal
- Est. fire insurance / yr
- $888 – $1,650
Heat risk 2/10 · Minimal
- Hot days now (above 99°F)
- 7 days/yr
- Hot days in 30 yrs
- 14 days/yr
Wind risk 2/10 · Minimal
- Chance of severe wind over 30 yrs
- —
Air-quality risk 2/10 · Minimal
- Unhealthy air days now
- 1 days/yr
- Unhealthy air days in 30 yrs
- 1 days/yr
Risk factors via First Street. Map © Google.
Why this score? — see what drove the D grade
The composite is a weighted blend of 9 inputs, each scored 0–100. Each bar is that input's sub-score; the figure is the points it added to the 100-point composite (weight × sub-score).
- Cash flow +16.2/30.0
- ARV discount +7.5/15.0
- 1% rule +5.2/10.0
- DSCR +5.0/10.0
- Rent growth +3.4/5.0
- Livability +2.5/5.0
- Condition / age +2.5/5.0
- Schools +2.4/10.0
- Appreciation +0.0/10.0
$265,000
🖨 Deal sheet (PDF) 📄 Offer letter ✓ Due diligence
Multi-family units
County records classify this as Multi-Family (2-4 Unit). Listing-text estimate: 2 units. confirmed
Listing remarks
Here’s a cleaner, more polished version with a little more warmth and flow: Discover the perfect blend of character, comfort, and flexibility in the highly sought-after North End neighborhood of Saint Paul! This spacious duplex features 4 bedrooms, 2 bathrooms, and 1,656 finished square feet, with each level offering 2 bedrooms and 1 bathroom for ideal functionality and versatility. Enjoy bright and inviting living spaces with a layout perfect for both everyday living and entertaining. Whether you're looking for an owner-occupant opportunity or an investment property, this duplex offers endless potential in a convenient location close to parks, shopping, dining, and easy freeway acce
Key facts
- 2,439 sq ft lot
- Garage
- Built 1908
Property features AI
Finance
- Other: Property classified as residential income with 2 total units; Total living area reported as 1,656 square feet; Building total area reported as 2,484
- Financial info: Gross annual income reported at $33,600
Exterior
- Parking: Detached or attached 1-car garage (approximately 120 sq ft)
- Utilities: City water (connected); City sewer (connected); Natural gas
- Home design: Residential income property (duplex, up and down); Two-story; Above-grade finished area and main level finished area totaling 1,656 square feet; Below-grade finished area included
- Construction: Block foundation
- Exterior features: Stucco exterior; Lot dimensions approximately 40 x 62
Interior
- Kitchen: Kitchens included in each unit
- Bedrooms: 4 bedrooms total; Each unit includes 2 bedrooms
- Bathrooms: 2 total bathrooms (each unit has 1 full bath)
- Heating & cooling: Baseboard heating; Boiler system
- Interior features: Two levels; Basement (block foundation)
- Laundry & utility: Utilities include natural gas
Neighborhood map
What this means for you Summary
Snapshot
- This is a 2 × 2-bed/1.0-bath units multifamily listed at $265k.
Deal economics
- At list price, monthly cash flow is $141 ($2k/yr) — positive. Per door: $70/mo.
- The deal already cash-flows at list — no discount required.
- Meets the 1% rule at list price ($3k rent vs $265k).
- Recommended offer: $257k (3.0% below list) — sets the bar for market timing.
Location & tenants
- Location reads: area grade D — affects rentability + tenant quality, not the cash-flow math above.
- St. Paul Public School District (urban): math 21% / reading 33% proficiency, ranked #270 of 301 in MN (top 90%) — low school quality limits family demand, transient renter base, plan for 1-2y turnover; 64% free/reduced lunch — lower-income household profile, screen leases tightly.
- Zoned schools: Mississippi Creative Arts Elem (math 17% / reading 17%, grade F, #771 of 857 statewide, top 91%, 566 students, 94% FRL) — zoned schools average 94% FRL vs 64% district-wide (30 pts higher); higher-poverty schools than district average — tighter screening recommended.
- Market conditions: Rents rising (+3.6%/yr); 175 active listings in the ZIP; 2 comparable units currently listed for rent nearby; 1,202 units permitted in Ramsey County in 2024 (880 in 5+ unit buildings).
- At $2,711/mo this rent would consume 46% of the median local household income ($71k/yr) (locally 1588% of renters already pay >50% of income on rent) — very limited rent-growth headroom before tenants either downsize or default.
Forward outlook
- Local home prices are declining (-3.0%/yr); year-one equity from $2k of loan paydown is wiped out by about $8k of value loss. Plan a longer hold.
- Ramsey County population projected at +27% by 2050 — long-run rental-demand tailwind backs the buy-and-hold thesis.
Negotiation context
- It's been on market 37 days — a 3% lower offer ($257k) is reasonable based on typical stale-listing flexibility.
- 3 sale attempts since 27y ago; this cycle's ask has dropped $25k (9%) from the opening price — seller is motivated, your offer sets the floor, not the list.
Risks & watch-outs
- Watch-outs: built in 1908 — expect roof / HVAC / electrical / plumbing capex.
Questions for the listing agent
- It's been on market 37 days. Have you received any prior offers? Is the seller open to a 3% concession, seller financing, or rate buy-down credit?
- Can we see the unit-by-unit rent roll, current vacancy, and any below-market leases? What's the average tenancy length?
- What capital expenditures (roof, boiler, parking lot, exteriors) have been made in the last 5 years, and what's planned in the next 2?
- Built in 1908 — when were the roof, HVAC, electrical panel, plumbing, and water heater last replaced?
- Is there a deadline driving the sale (1031 exchange, divorce, estate, relocation)? That informs how much negotiation room exists.
- The area grade is low — what's the realistic commute time and amenity access for the typical tenant pool here? Any planned neighborhood developments (good or bad) we should know about?
- What's the average days-on-market for RENTAL listings here right now (not sales)? A rising rental-DOM trend means longer vacancies and softer asking-rent achievability than the comps imply.
- What's the recent tenant-quality profile in this submarket — average credit score on applications, eviction rate, late-payment / NSF rate, and stable-employment percentage? A property-management company in the area should have these aggregated.
- How much new apartment / multifamily construction is in the pipeline within 1–3 miles? Heavy new supply (>2% of stock underway) typically softens rents 12–24 months out; light construction supports rent growth.
Investment metrics
- 1% rule
- 1.02% ✓
- Cap rate
- 6.93%
- Cash-on-cash
- 2.28%
- DSCR
- 1.10
- GRM
- 8.1
CMA / ARV
No comps found within radius.
Projected returns pro-forma
-3.0% appreciation · 3.6% rent growth · sell at horizon
- IRR
- -11.9%
- Equity multiple
- 0.57×
- Total profit
- $-32,185
- Equity at exit
- $39,512
- IRR
- -1.7%
- Equity multiple
- 0.88×
- Total profit
- $-9,055
- Equity at exit
- $22,912
Cash invested: $74,200 (down + closing). Projections, not guarantees.
Landlord ↔ Tenant lean methodology
- Overall (STATE)
- 46 Balanced
- State Minnesota
- 46 Balanced · D+2
- County
- — inherits STATE
- City
- — inherits STATE
ZIP-level market 55117
- Rents YoY
- 3.6%
- Active inventory
- 175
- Price-to-rent
- 16.3×
Monthly cashflow live
- Estimated rent
- $2,711 medium interval (Pro) →
- Mortgage (P&I)
- −$1,390
- Tax from tax record
- −$501 /mo · $6,010/yr
- Insurance
- −$110
- HOA
- −$0
- Vacancy / Maint / Mgmt
- −$569
- Net cashflow
- $141
Break-even live
Sensitivity live
| Price | -10% $291 | -5% $216 | +0% $141 | +5% $66 | +10% $-9 |
|---|---|---|---|---|---|
| Rent | -10% $-73 | -5% $34 | +0% $141 | +5% $248 | +10% $355 |
| Rate | -1.0pp $274 | -0.5pp $208 | base $141 | +0.5pp $72 | +1.0pp $2 |
2-unit breakdown (identical units grouped — click to expand)
| Units | Beds | Baths | Est. rent |
|---|---|---|---|
| 2× units | 2 | 1 | $2,710 |
| #1 | 2 | 1 | $1,355 |
| #2 | 2 | 1 | $1,355 |
| Total (2 units) | $2,711 | ||
UW: 25.0% down · 7.5% · 30yr · 1.5% tax · 5.0% vac · 8.0% maint · 8.0% mgmt
Financing live
Cash to close
- Down payment
- $66,250
- Closing costs
- $7,950
- Reserves months
- —
- Total cash needed
- —
Loan-product check · same deal, 3 products live
Conventional
25% down · 7.5% · 30yr
- Down + closing
- —
- Monthly P&I
- —
- Monthly cashflow
- —
- DSCR
- —
- Eligible?
- —
Personal DTI + credit; lowest rate.
DSCR
20% down · 8.5% · 30yr
- Down + closing
- —
- Monthly P&I
- —
- Monthly cashflow
- —
- DSCR
- —
- Eligible?
- —
No personal income docs; deal must DSCR.
Hard money
10% down · 12.0% · 12mo
- Down + closing
- —
- Monthly P&I
- —
- Monthly cashflow
- —
- DSCR
- —
- Eligible?
- —
Short-term bridge; refi at stabilization.
Rent comps 2 comps
| Address | Beds | Baths | Sqft | Rent | $/sqft | DOM | Units | Dist |
|---|---|---|---|---|---|---|---|---|
| 585 Cottage Ave W Saint Paul, MN | 4.0 | 2.0 | 1940 | $2,995 | $1.54 | 22d | 1 | 1.23mi |
| 1443 Saint Albans St N Saint Paul, MN | 4.0 | 2.0 | 1500 | $2,700 | $1.80 | 19d | 1 | 1.47mi |
Listing history 17 events
-
2026-06-21days on market $265,000 Active 37 DOM
-
2026-06-18pricedays on market $265,000 Active 34 DOM
-
2026-06-09days on market $290,000 Active 33 DOM
-
2026-06-08days on market $290,000 Active 32 DOM
-
2026-06-07days on market $290,000 Active 31 DOM
-
2026-06-04days on market $290,000 Active 28 DOM
-
2026-06-03days on market $290,000 Active 27 DOM
-
2026-06-02days on market $290,000 Active 26 DOM
-
2026-06-01days on market $290,000 Active 25 DOM
-
2026-05-31days on market $290,000 Active 24 DOM
-
2026-05-07$290,000 Active 812-char remark
-
2024-07-17soldstatus $285,000
-
2019-06-26soldstatus $213,000
-
2000-03-06soldstatus $52,000
-
2000-01-28soldstatus $52,000
-
2000-01-08historical
-
1999-08-12$49,900
ⓘ Source: listings_history table (triggers on properties + properties_extension) + one-shot
backfill from property_details.listing_events for pre-trigger history.
Tax reassessment forecast MN · Partial reset (capped growth)
- Current annual tax
- $6,010 · $501/mo
- Projected year-2 tax
- $6,010 · $501/mo
- Expected delta
- $0/yr ($0/mo · 0.0%)
ⓘ Screening estimate from a state-policy table — verify with the county assessor before closing.
Climate risk First Street
- Flood 1/10 Low FEMA zone X (unshaded) · 0% chance over 30 yrs
- Wildfire 1/10 Low
- Heat 2/10 Low 7 d/yr ≥99°F today · 14 d/yr by 30 yrs out
- Wind 2/10 Low
- Air quality 2/10 Low 1 unhealthy d/yr today · 1 by 30 yrs out
Nearby sold comps map
Loading sold comps map…
Walkable amenities ~0.75 mi
Loading nearby amenities…
Taxation est. · year 1
- Rental income
- $32,532
- − Mortgage interest
- −$14,844
- − Property taxes
- −$6,010
- − Insurance
- −$1,325
- − Repairs & maintenance
- −$2,603
- − Management
- −$2,603
- − Depreciation
- −$7,709
- Taxable loss
- −$2,561
- Est. tax savings @ 24.0%
- +$615
- After-tax cash flow
- $2,304/yr
For passive investors: Depreciation is non-cash, so a rental often shows a tax loss while cash-flowing — sheltering income. Rental losses are passive: they offset passive income freely, and up to $25,000/yr can offset ordinary (W-2) income if you actively participate and your MAGI is under $100k (phasing out to $0 by $150k); unused losses carry forward. On sale, claimed depreciation is recaptured at up to 25%, and gains may owe capital-gains tax (a 1031 exchange can defer both). Figures are a year-1 estimate at your 24.0% rate — not tax advice; consult a CPA.
Schools (NCES district)
- District
- St. Paul Public School District
- NCES district ID
- 2733840
- Math proficiency
- 21% ▼ -11.00%
- Reading proficiency
- 33% ▼ -7.00%
- Median HH income
- $48,316
- Composite
- 23.51/100
- National rank
- #7868
- State rank
- #270 of 301 in MN
Livability — St. Paul
No livability data for this city. (Only ~50 U.S. cities are tracked.)
Census & demographics
- Census place
- St. Paul, MN
- County
- Ramsey County · 542,837 people
- City population
- 280,599
- Metro
- Minneapolis-St. Paul-Bloomington, MN-WI
- Population (ZIP)
- 44,697
- Household income
- $70,771
- Rent vs Own
- Severe rent burden
- 1588.0
Population outlook (Ramsey County) Hauer SSP2
- Today (2025)
- 603,431 people
- By 2030
- 636,459 · +5.5%
- By 2040
- 700,596 · +16.1%
- By 2050
- 765,819 · +26.9%
- By 2075
- 929,297 · +54.0%
- By 2100
- 1,053,924 · +74.7%
Race, ethnicity, and origin ACS 2023
- Neighborhood character
- Highly diverse neighborhood (Simpson 0.72)
- Race & ethnicity
- White 44% Asian 24% Black 15% Hispanic / Latino 10% Two or more races 10%
- Hispanic origin (detail)
- Mexican 7%
- Common ancestry
- Portuguese 6% Romanian 3% Lithuanian 2%
- Foreign-born
- 21% · Canada, Philippines, India
- Languages at home
- 68% English-only · Other Asian/Pacific 15% Spanish 8% Other Indo-European 2%
Political lean MEDSL · Ramsey
- 2024 margin
- Solid D (+43.3) · D 70.5% · R 27.2% · Other 2.3%
- 2008→2024 swing
- +9.4pp toward D · 2008: 33.9pp · 2024: 43.3pp
- All cycles
- 2024: D+43.3 2020: D+45.4 2016: D+39.4 2012: D+35.3 2008: D+33.9
Not yet ingested
- Civics
- —
Market trends
- HPI YoY
- ▼ -308.56%
- Current HPI
- 267.4216
- Rent YoY
- ▲ 3.60%
- Metro
- Minneapolis-St. Paul-Bloomington, MN-WI
- State GDP YoY
- ▲ 2.41%
- F500 in state
- 34
Industry mix (Fortune 500 HQ in MN)
| Industry | F500 HQs | Revenue |
|---|---|---|
| Healthcare | 2 | $407B |
|
||
| Retail | 2 | $150B |
|
||
| Consumer Goods | 2 | $32B |
|
||
| Industrial Machinery | 2 | $6B |
|
||
| Agriculture | 1 | $40B |
|
||
| Healthcare / Medical Devices | 1 | $32B |
|
||
Price history
+431.1% since first listed9 events — show timeline
- 2026-06-18 Relisted — NORTHSTARMLS as Distributed by MLS Grid
- 2026-06-18 Price Changed $265,000 NORTHSTARMLS as Distributed by MLS Grid
- 2026-05-07 Listed $290,000 NORTHSTARMLS as Distributed by MLS Grid
- 2024-07-17 Sold (Public Records) $285,000 Public Records
- 2019-06-26 Sold (Public Records) $213,000 Public Records
- 2000-03-06 Sold (Public Records) $52,000 Public Records
- 2000-01-28 Sold (MLS) $52,000 NORTHSTARMLS as Distributed by MLS Grid
- 2000-01-08 Listing Removed — NORTHSTARMLS as Distributed by MLS Grid
- 1999-08-12 Listed $49,900 NORTHSTARMLS as Distributed by MLS Grid
Property tax history
+16.0%/yrLatest (2025): $6,010 · +35.0% YoY. Source: county tax records.
Cash-flow waterfall
monthlySold comps — $/sqft
last 12 mo · ≤1 miLoading sold comps…