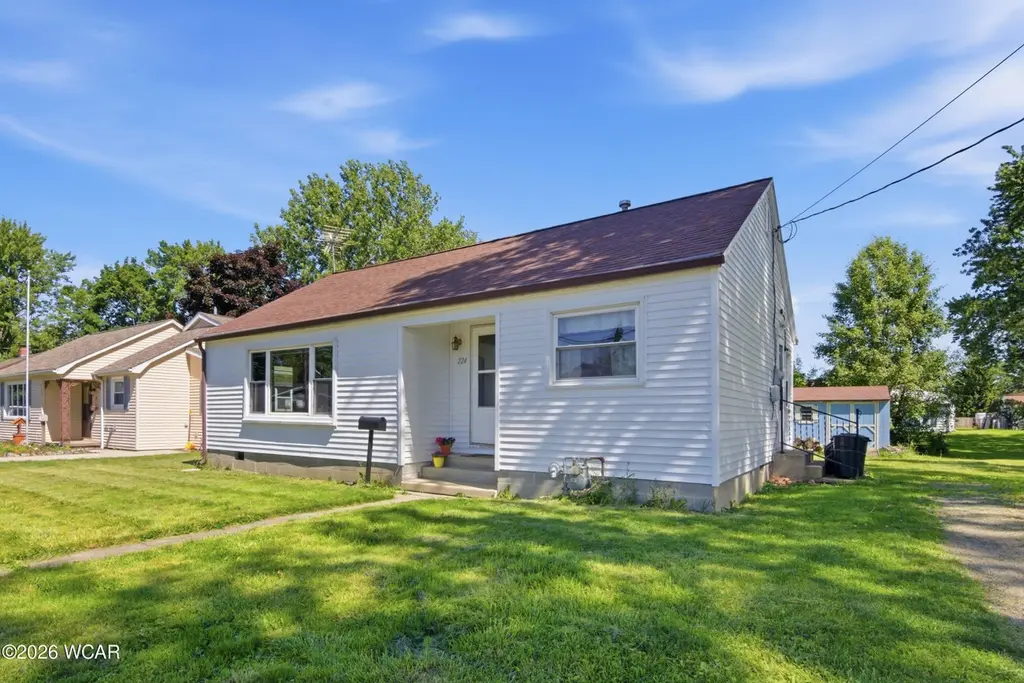
224 Spencer Dr
Van Wert, OH 45891
$115,000C+
2 bd · 1.0 ba ·
840 sqft ·
Built 1953
· SingleFamily
· Pending
· 4 DOM
Cashflow @ list (25.0% down · 7.5%)
Estimated rent
$1,225/mo
Mortgage (P&I)
−$603
Tax + insurance
−$224
HOA
−$0
Vac / Maint / Mgmt
−$257
Net cashflow
$140/mo
Annual
$1,683/yr
Cap rate
9.06%
Cash-on-cash
9.89%
DSCR
1.44
1% rule
1.06%
Cash to close
$32,200
Investor read
- This is a 2-bed/1.0-bath single-family listed at $115k.
- At list price, monthly cash flow is $140 ($2k/yr) — positive.
- The deal already cash-flows at list — no discount required.
- Meets the 1% rule at list price ($1k rent vs $115k).
- Only 4 days on market — expect competitive offers; lowballing is unlikely to land.
- Local home prices are declining (-3.0%/yr); year-one equity from $795 of loan paydown is wiped out by about $3k of value loss. Plan a longer hold.
- Location reads 72/100 on livability (#392 in OH) — a middle-class / working-renter tenant base. Strengths: cost of living A+, housing A+, health & safety A-; Watch: crime D+, amenities F, commute F.
- Van Wert City (rural): math 46% / reading 50% proficiency, ranked #476 of 656 in OH (top 73%) — families likely to look elsewhere, expect single-tenant / working-renter base with shorter leases.
- Zoned schools: Van Wert Elementary School (math 57% / reading 55%, grade C+, #766 of 1,584 statewide, top 49%, 647 students, 54% FRL); Van Wert Middle School (math 38% / reading 44%, grade F, #505 of 654 statewide, top 78%, 396 students, 0% FRL); Van Wert High School (math 42% / reading 57%, grade D, #390 of 781 statewide, top 54%, 593 students, 79% FRL).
- Watch-outs: flood insurance adds $125/mo; built in 1953 — expect roof / HVAC / electrical / plumbing capex.
- Market conditions: 46 active listings in the ZIP; 2 comparable units currently listed for rent nearby; 44 units permitted in Van Wert County in 2024 (0 in 5+ unit buildings).
- Van Wert County population projected at -11% by 2050 — secular population decline; favor cash flow + early exit over multi-decade hold.
- 2 sale attempts since 3y ago with the ask held roughly flat each time — persistent listings suggest the price (not the market) is what's stuck; bring a comps-based counter.
- Current owner paid $79k; 45% above their basis — modest negotiation headroom, anchor on the comps not their cost.
- Climate carrying-cost: in FEMA flood zone A (mandatory federal flood insurance) — expect insurance premiums to compound above CPI over the hold.
- Cap rate 9.1% vs local median 4.6% in Van Wert — top-decile yield for the area; either an underpriced asset or a hidden risk that comps aren't pricing in. Stress-test before assuming the spread holds.
Questions for listing agent
- Built in 1953 — when were the roof, HVAC, electrical panel, plumbing, and water heater last replaced?
- What's the actual annual flood-insurance premium (NFIP or private), and is the property in a SFHA with mandatory coverage?
- Is there a deadline driving the sale (1031 exchange, divorce, estate, relocation)? That informs how much negotiation room exists.
- Schools are B-rated — typically a magnet for longer-tenancy family renters. What's the average tenant stay here, and is there a school-zone premium baked into asking?
- Crime grade is D in this area — have there been break-ins, vandalism, or insurance claims at this property in the last 3 years? What carrier currently insures it and at what premium?
- What's the average days-on-market for RENTAL listings here right now (not sales)? A rising rental-DOM trend means longer vacancies and softer asking-rent achievability than the comps imply.
- What's the recent tenant-quality profile in this submarket — average credit score on applications, eviction rate, late-payment / NSF rate, and stable-employment percentage? A property-management company in the area should have these aggregated.
- How much new for-sale + rental construction is in the pipeline within 1–3 miles? Heavy new supply typically softens prices + rents 12–24 months out; constrained supply supports both.
CashFlowRE · CFR-0QC6GB10AACRV6
· Data 1 week ago
cashflowre.app · 2026-05-29