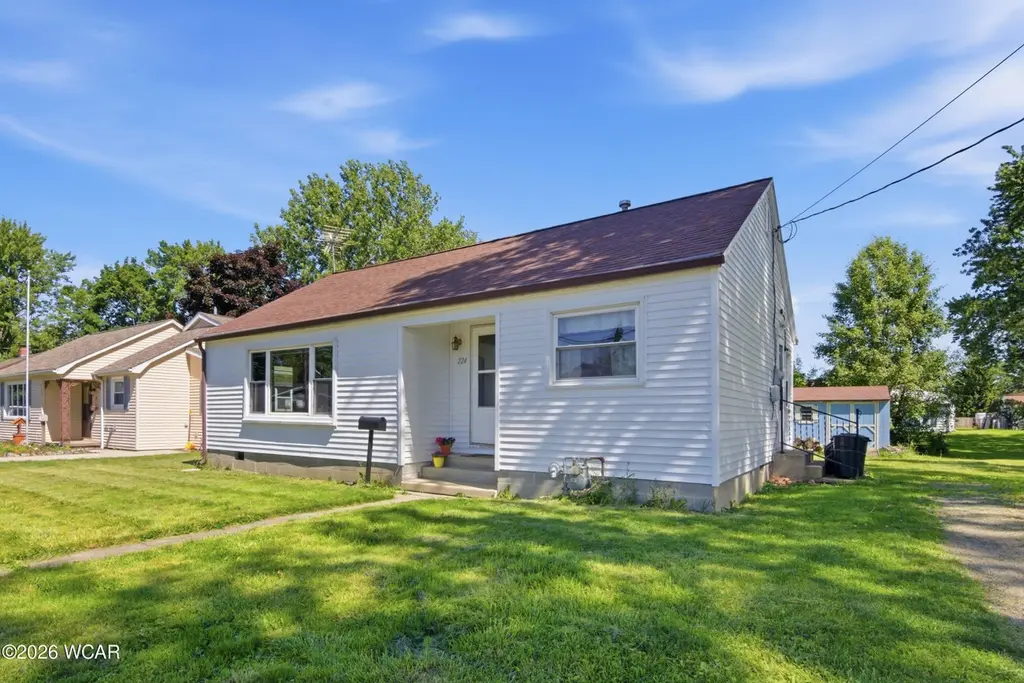
224 Spencer Dr · Van Wert, OH
Flood risk 8/10 · Major
- FEMA flood zone
- A
- Chance of flooding over 30 yrs
- 0.99%
- Est. flood insurance / yr
- $1,009 – $1,996
Fire risk 1/10 · Minimal
- Est. fire insurance / yr
- $713 – $1,323
Heat risk 3/10 · Minor
- Hot days now (above 100°F)
- 7 days/yr
- Hot days in 30 yrs
- 18 days/yr
Wind risk 2/10 · Minimal
- Chance of severe wind over 30 yrs
- —
Air-quality risk 2/10 · Minimal
- Unhealthy air days now
- 1 days/yr
- Unhealthy air days in 30 yrs
- 2 days/yr
Risk factors via First Street. Map © Google.
Why this score? — see what drove the C+ grade
The composite is a weighted blend of 9 inputs, each scored 0–100. Each bar is that input's sub-score; the figure is the points it added to the 100-point composite (weight × sub-score).
- Cash flow +25.4/30.0
- ARV discount +9.4/15.0
- DSCR +8.4/10.0
- 1% rule +5.6/10.0
- Schools +4.0/10.0
- Livability +3.6/5.0
- Rent growth +2.5/5.0
- Condition / age +2.5/5.0
- Appreciation +0.0/10.0
$115,000
🖨 Deal sheet (PDF) 📄 Offer letter ✓ Due diligence
Listing remarks MLS
Very well maintained 2 bedroom 1 bath ranch. Quiet street with minimal traffic. 2 sheds in the backyard. Simple living at an affordable price.
Key facts
- All new siding
- Two storage sheds
- Gas forced air heat
Tags
Property features AI
Finance
- Other: Listing broker: Bee Gee Realty & Auction Company
Exterior
- Parking: See remarks for parking details
- Utilities: Public water; Public sewer; Electricity connected; Natural gas connected; Water connected
- Home design: Single-family residence; One level
- Construction: Vinyl siding construction
- Exterior features: Vinyl siding; Shed on property; Lot dimensions approximately 65 x 81; Residential zoning
Interior
- Kitchen: Range; Refrigerator; Dishwasher not listed
- Flooring: Carpet; Laminate
- Bathrooms: 1 full bathroom
- Heating & cooling: Central air conditioning; Forced air heating (natural gas)
- Interior features: Washer and Dryer included; Range; Refrigerator; Carpet and laminate flooring; Total of 5 rooms
- Laundry & utility: Washer; Dryer
Neighborhood map
What this means for you Summary
Snapshot
- This is a 2-bed/1.0-bath single-family listed at $115k.
Deal economics
- At list price, monthly cash flow is $140 ($2k/yr) — positive.
- The deal already cash-flows at list — no discount required.
- Meets the 1% rule at list price ($1k rent vs $115k).
- Cap rate 9.1% vs local median 4.6% in Van Wert — top-decile yield for the area; either an underpriced asset or a hidden risk that comps aren't pricing in. Stress-test before assuming the spread holds.
Location & tenants
- Location reads 72/100 on livability (#392 in OH) — a middle-class / working-renter tenant base. Strengths: cost of living A+, housing A+, health & safety A-; Watch: crime D+, amenities F, commute F.
- Van Wert City (rural): math 46% / reading 50% proficiency, ranked #476 of 656 in OH (top 73%) — families likely to look elsewhere, expect single-tenant / working-renter base with shorter leases.
- Zoned schools: Van Wert Elementary School (math 57% / reading 55%, grade C+, #766 of 1,584 statewide, top 49%, 647 students, 54% FRL); Van Wert Middle School (math 38% / reading 44%, grade F, #505 of 654 statewide, top 78%, 396 students, 0% FRL); Van Wert High School (math 42% / reading 57%, grade D, #390 of 781 statewide, top 54%, 593 students, 79% FRL).
- Market conditions: 46 active listings in the ZIP; 2 comparable units currently listed for rent nearby; 44 units permitted in Van Wert County in 2024 (0 in 5+ unit buildings).
Forward outlook
- Local home prices are declining (-3.0%/yr); year-one equity from $795 of loan paydown is wiped out by about $3k of value loss. Plan a longer hold.
- Van Wert County population projected at -11% by 2050 — secular population decline; favor cash flow + early exit over multi-decade hold.
Negotiation context
- Only 4 days on market — expect competitive offers; lowballing is unlikely to land.
- 2 sale attempts since 3y ago with the ask held roughly flat each time — persistent listings suggest the price (not the market) is what's stuck; bring a comps-based counter.
- Current owner paid $79k; 45% above their basis — modest negotiation headroom, anchor on the comps not their cost.
Risks & watch-outs
- Watch-outs: flood insurance adds $125/mo; built in 1953 — expect roof / HVAC / electrical / plumbing capex.
- Climate carrying-cost: in FEMA flood zone A (mandatory federal flood insurance) — expect insurance premiums to compound above CPI over the hold.
Questions for the listing agent
- Built in 1953 — when were the roof, HVAC, electrical panel, plumbing, and water heater last replaced?
- What's the actual annual flood-insurance premium (NFIP or private), and is the property in a SFHA with mandatory coverage?
- Is there a deadline driving the sale (1031 exchange, divorce, estate, relocation)? That informs how much negotiation room exists.
- Schools are B-rated — typically a magnet for longer-tenancy family renters. What's the average tenant stay here, and is there a school-zone premium baked into asking?
- Crime grade is D in this area — have there been break-ins, vandalism, or insurance claims at this property in the last 3 years? What carrier currently insures it and at what premium?
- What's the average days-on-market for RENTAL listings here right now (not sales)? A rising rental-DOM trend means longer vacancies and softer asking-rent achievability than the comps imply.
- What's the recent tenant-quality profile in this submarket — average credit score on applications, eviction rate, late-payment / NSF rate, and stable-employment percentage? A property-management company in the area should have these aggregated.
- How much new for-sale + rental construction is in the pipeline within 1–3 miles? Heavy new supply typically softens prices + rents 12–24 months out; constrained supply supports both.
Investment metrics
- 1% rule
- 1.06% ✓
- Cap rate
- 9.06%
- Cash-on-cash
- 9.89%
- DSCR
- 1.44
- GRM
- 7.8
CMA / ARV
- ARV (on-the-fly)
- $120,120
- Comps found
- 12
Show comp detail 12 sales within ~0.75 mi
| Address | Dist | Beds/Ba | Sqft | Sold | Price | $/sf | Match |
|---|---|---|---|---|---|---|---|
| 923 Pratt St | 0.51mi | 3/1.0 (+1) | 856 (+2%) | 1mo | $108,000 | $126 | 67 |
| 323 Gordon Ave | 0.38mi | 2/1.0 | 942 (+12%) | 5mo | $135,000 | $143 | 58 |
| 825 S Race St | 0.34mi | 2/1.0 | 962 (+14%) | 5mo | $161,000 | $167 | 56 |
| 337 S Fulton St | 0.65mi | 2/1.0 | 832 (-1%) | 16mo | $25,000 | $30 | 54 |
| 609 S Franklin St | 0.39mi | 2/1.0 | 768 (-9%) | 17mo | $139,000 | $181 | 53 |
| 408 S Chestnut St | 0.39mi | 1/1.0 (-1) | 925 (+10%) | 10mo | $149,000 | $161 | 51 |
| 310 E Sycamore St | 0.59mi | 2/1.0 | 780 (-7%) | 15mo | $139,000 | $178 | 48 |
| 606 State St | 0.71mi | 2/1.0 | 768 (-9%) | 13mo | $95,000 | $124 | 42 |
| 626 S Wayne St | 0.55mi | 2/1.5 | 900 (+7%) | 23mo | $174,500 | $194 | 41 |
| 411 E Sycamore St | 0.62mi | 2/1.0 | 952 (+13%) | 9mo | $88,000 | $92 | 41 |
| 627 William St | 0.58mi | 3/1.5 (+1) | 960 (+14%) | 13mo | $91,000 | $95 | 31 |
| 412 E Sycamore St | 0.60mi | 2/1.0 | 720 (-14%) | 24mo | $85,000 | $118 | 28 |
Match score weights: distance 35% · size 25% · config 20% · recency 20%. Top-matched comps best support the ARV.
Projected returns pro-forma
-3.0% appreciation · 3.0% rent growth · sell at horizon
- IRR
- -8.2%
- Equity multiple
- 0.70×
- Total profit
- $-9,662
- Equity at exit
- $17,147
- IRR
- 1.4%
- Equity multiple
- 1.10×
- Total profit
- $3,247
- Equity at exit
- $9,943
Cash invested: $32,200 (down + closing). Projections, not guarantees.
Landlord ↔ Tenant lean methodology
- Overall (STATE)
- 73 Landlord-Friendly
- State Ohio
- 73 Landlord-Friendly · R+6
- County
- — inherits STATE
- City
- — inherits STATE
ZIP-level market 45891
- Home prices YoY
- -17.0%
- Active inventory
- 46
- Price-to-rent
- 7.8×
Monthly cashflow live
- Estimated rent
- $1,225 medium interval (Pro) →
- Mortgage (P&I)
- −$603
- Tax from tax record
- −$51 /mo · $612/yr
- Insurance
- −$48
- Flood insurance flood zone
- −$125 /mo · $1,502/yr
- HOA
- −$0
- Vacancy / Maint / Mgmt
- −$257
- Net cashflow
- $140
Break-even live
Sensitivity live
| Price | -10% $205 | -5% $173 | +0% $140 | +5% $108 | +10% $75 |
|---|---|---|---|---|---|
| Rent | -10% $44 | -5% $92 | +0% $140 | +5% $189 | +10% $237 |
| Rate | -1.0pp $198 | -0.5pp $170 | base $140 | +0.5pp $110 | +1.0pp $80 |
UW: 25.0% down · 7.5% · 30yr · 1.5% tax · 5.0% vac · 8.0% maint · 8.0% mgmt
Financing live
Cash to close
- Down payment
- $28,750
- Closing costs
- $3,450
- Reserves months
- —
- Total cash needed
- —
Loan-product check · same deal, 3 products live
Conventional
25% down · 7.5% · 30yr
- Down + closing
- —
- Monthly P&I
- —
- Monthly cashflow
- —
- DSCR
- —
- Eligible?
- —
Personal DTI + credit; lowest rate.
DSCR
20% down · 8.5% · 30yr
- Down + closing
- —
- Monthly P&I
- —
- Monthly cashflow
- —
- DSCR
- —
- Eligible?
- —
No personal income docs; deal must DSCR.
Hard money
10% down · 12.0% · 12mo
- Down + closing
- —
- Monthly P&I
- —
- Monthly cashflow
- —
- DSCR
- —
- Eligible?
- —
Short-term bridge; refi at stabilization.
Rent comps 2 comps
| Address | Beds | Baths | Sqft | Rent | $/sqft | DOM | Units | Dist |
|---|---|---|---|---|---|---|---|---|
| 330 Davis St Van Wert, OH | 2.0 | 1.0 | 768 | $1,250 | $1.63 | 45d | 1 | 1.03mi |
| 693 N Cherry St Van Wert, OH | 3.0 | 1.0 | 864 | $1,200 | $1.39 | 45d | 1 | 1.07mi |
Listing history 4 events
-
2026-06-09statusdays on market $115,000 Pending 4 DOM
-
2026-06-08days on market $115,000 Active 3 DOM
-
2026-06-08remarks 690-char remark
-
2026-06-08$115,000 Active 2 DOM
ⓘ Source: listings_history table (triggers on properties + properties_extension) + one-shot
backfill from property_details.listing_events for pre-trigger history.
Tax reassessment forecast OH · Partial reset (capped growth)
- Current annual tax
- $612 · $51/mo
- Projected year-2 tax
- $1,203 · $100/mo
- Expected delta
- +$591/yr (+$49/mo · 96.5%)
ⓘ Screening estimate from a state-policy table — verify with the county assessor before closing.
Climate risk First Street
- Flood 8/10 Severe FEMA zone A · 99% chance over 30 yrs
- Wildfire 1/10 Low
- Heat 3/10 Moderate 7 d/yr ≥100°F today · 18 d/yr by 30 yrs out
- Wind 2/10 Low
- Air quality 2/10 Low 1 unhealthy d/yr today · 2 by 30 yrs out
Nearby sold comps map
Loading sold comps map…
Walkable amenities ~0.75 mi
Loading nearby amenities…
Taxation est. · year 1
- Rental income
- $14,696
- − Mortgage interest
- −$6,442
- − Property taxes
- −$612
- − Insurance
- −$2,078
- − Repairs & maintenance
- −$1,176
- − Management
- −$1,176
- − Depreciation
- −$3,345
- Taxable loss
- −$132
- Est. tax savings @ 24.0%
- +$32
- After-tax cash flow
- $1,715/yr
For passive investors: Depreciation is non-cash, so a rental often shows a tax loss while cash-flowing — sheltering income. Rental losses are passive: they offset passive income freely, and up to $25,000/yr can offset ordinary (W-2) income if you actively participate and your MAGI is under $100k (phasing out to $0 by $150k); unused losses carry forward. On sale, claimed depreciation is recaptured at up to 25%, and gains may owe capital-gains tax (a 1031 exchange can defer both). Figures are a year-1 estimate at your 24.0% rate — not tax advice; consult a CPA.
Schools (NCES district)
- District
- Van Wert City
- NCES district ID
- 3910023
- Math proficiency
- 46% ▼ -16.00%
- Reading proficiency
- 50% ▼ -13.00%
- Median HH income
- $41,846
- Composite
- 40.34/100
- National rank
- #3745
- State rank
- #476 of 656 in OH
Livability — Van Wert
- Score
- 72/100
- State rank
- #392
- US rank
- #6388
Category grades
Schools grade is shown separately in the Schools card above.
Census & demographics
- Census place
- Van Wert, OH
- County
- Van Wert · 34,605 people
- City population
- 15,522
- Population (ZIP)
- 15,522
- Household income
- $62,944
- Rent vs Own
- Severe rent burden
- 9.1
Population outlook (Van Wert County) Hauer SSP2
- Today (2025)
- 28,235 people
- By 2030
- 27,793 · -1.6%
- By 2040
- 26,650 · -5.6%
- By 2050
- 25,251 · -10.6%
- By 2075
- 22,247 · -21.2%
- By 2100
- 18,559 · -34.3%
Race, ethnicity, and origin ACS 2023
- Neighborhood character
- Predominantly White (92%)
- Race & ethnicity
- White 92% Two or more races 4% Hispanic / Latino 4%
- Common ancestry
- Iranian 2% Lithuanian 2% Slovak 2%
- Foreign-born
- 1% · Canada
- Languages at home
- 97% English-only · Spanish 2%
Political lean MEDSL · Van Wert
- 2024 margin
- Solid R (+58.5) · D 20.4% · R 78.9%
- 2008→2024 swing
- -31.3pp toward R · 2008: -27.2pp · 2024: -58.5pp
- All cycles
- 2024: R+58.5 2020: R+57.4 2016: R+56.4 2012: R+40.5 2008: R+27.2
Not yet ingested
- Civics
- —
Market trends
- HPI YoY
- ▼ -49.58%
- Current HPI
- 242.1743
- Rent YoY
- —
- Metro
- —
- State GDP YoY
- ▲ 1.98%
- F500 in state
- 48
Industry mix (Fortune 500 HQ in OH)
| Industry | F500 HQs | Revenue |
|---|---|---|
| Insurance | 3 | $145B |
|
||
| Industrial Machinery | 3 | $49B |
|
||
| Financial Services | 3 | $24B |
|
||
| Consumer Goods | 2 | $93B |
|
||
| Aerospace / Defense | 2 | $47B |
|
||
| Utilities | 2 | $33B |
|
||
Price history
+43.8% since first listed5 events — show timeline
- 2026-06-05 Listed $115,000 WCARE
- 2023-12-08 Sold (Public Records) $79,400 Public Records
- 2023-12-07 Sold (MLS) $79,400 WCARE
- 2023-11-09 Pending — WCARE
- 2023-10-31 Listed $80,000 WCARE
Property tax history
-1.5%/yrLatest (2025): $612 · +1.6% YoY. Source: county tax records.
Cash-flow waterfall
monthlySold comps — $/sqft
last 12 mo · ≤1 miLoading sold comps…