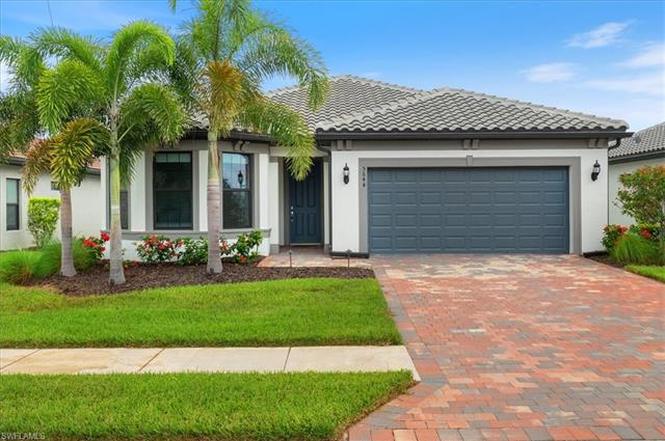
5644 Celebration Dr
Ave Maria, FL 34142
$440,000C-
3 bd · 2.0 ba ·
1,816 sqft ·
Built 2023
· SingleFamily
· Active
· 344 DOM
Cashflow @ list (25.0% down · 7.5%)
Estimated rent
$4,665/mo
Mortgage (P&I)
−$2,307
Tax + insurance
−$918
HOA
−$476
Vac / Maint / Mgmt
−$980
Net cashflow
$-16/mo
Annual
$-197/yr
Cap rate
6.66%
Cash-on-cash
1.32%
DSCR
1.06
1% rule
1.06%
Cash to close
$123,200
Investor read
- This is a 3-bed/2.0-bath single-family listed at $440k.
- At list price, monthly cash flow is $-16 ($-197/yr) — negative.
- To cash-flow at today's rent, offer at most $437k (0.7% below list).
- Meets the 1% rule at list price ($5k rent vs $440k).
- It's been on market 344 days — a 12% lower offer ($387k) is reasonable based on typical stale-listing flexibility.
- Recommended offer: $387k (12.0% below list) — sets the bar for market timing.
- Local home prices are declining (-1.1%/yr); year-one equity from $3k of loan paydown is wiped out by about $5k of value loss. Plan a longer hold.
- Location reads: area grade C — affects rentability + tenant quality, not the cash-flow math above.
- Collier (suburban): math 60% / reading 56% proficiency, ranked #16 of 73 in FL (top 22%) — acceptable for families but not a draw, mixed tenant base, ~2y average lease.
- Zoned schools: Estates Elementary School (math 70% / reading 67%, grade B+, #409 of 2,144 statewide, top 20%, 862 students, 53% FRL); Palmetto Ridge High School (math 43% / reading 51%, grade D-, #207 of 667 statewide, top 32%, 2,347 students, 38% FRL).
- Watch-outs: flood insurance adds $152/mo.
- Market conditions: Rents rising (+3.0%/yr); 449 active listings in the ZIP; 40 comparable units currently listed for rent nearby; rentals at typical pace (median 24d on market — plan ~3-4 weeks tenant-placement turnaround); 3,520 units permitted in Collier County in 2024 (959 in 5+ unit buildings).
- Collier County population projected at +30% by 2050 — long-run rental-demand tailwind backs the buy-and-hold thesis.
- 3 sale attempts since 2y ago; this cycle's ask has dropped $80k (15%) from the opening price — seller is motivated, your offer sets the floor, not the list.
- Climate carrying-cost: in FEMA flood zone AH (mandatory federal flood insurance); severe wind risk, 99% chance of damaging wind over 30y; extreme-heat days projected 7→27/yr by 2055 (HVAC capex compounding) — expect insurance premiums to compound above CPI over the hold.
- At $4,665/mo this rent would consume 90% of the median local household income ($62k/yr) (locally 1093% of renters already pay >50% of income on rent) — very limited rent-growth headroom before tenants either downsize or default.
Questions for listing agent
- What do current leases actually rent for vs. the listed asking? Can we see a recent rent roll and the last 12 months of T-12 income?
- It's been on market 344 days. Have you received any prior offers? Is the seller open to a 12% concession, seller financing, or rate buy-down credit?
- What's the actual annual flood-insurance premium (NFIP or private), and is the property in a SFHA with mandatory coverage?
- What does the HOA fee cover, when was the last increase, and are there any pending special assessments or reserve-fund shortfalls?
- Why hasn't it sold? Are there any deal-killer items the seller is aware of (foundation, flood, title, zoning, code violations)?
- Is there a deadline driving the sale (1031 exchange, divorce, estate, relocation)? That informs how much negotiation room exists.
- What's the average days-on-market for RENTAL listings here right now (not sales)? A rising rental-DOM trend means longer vacancies and softer asking-rent achievability than the comps imply.
- What's the recent tenant-quality profile in this submarket — average credit score on applications, eviction rate, late-payment / NSF rate, and stable-employment percentage? A property-management company in the area should have these aggregated.
CashFlowRE · CFR-0RSCDS173E5CCG
· Data 2 days ago
cashflowre.app · 2026-05-29