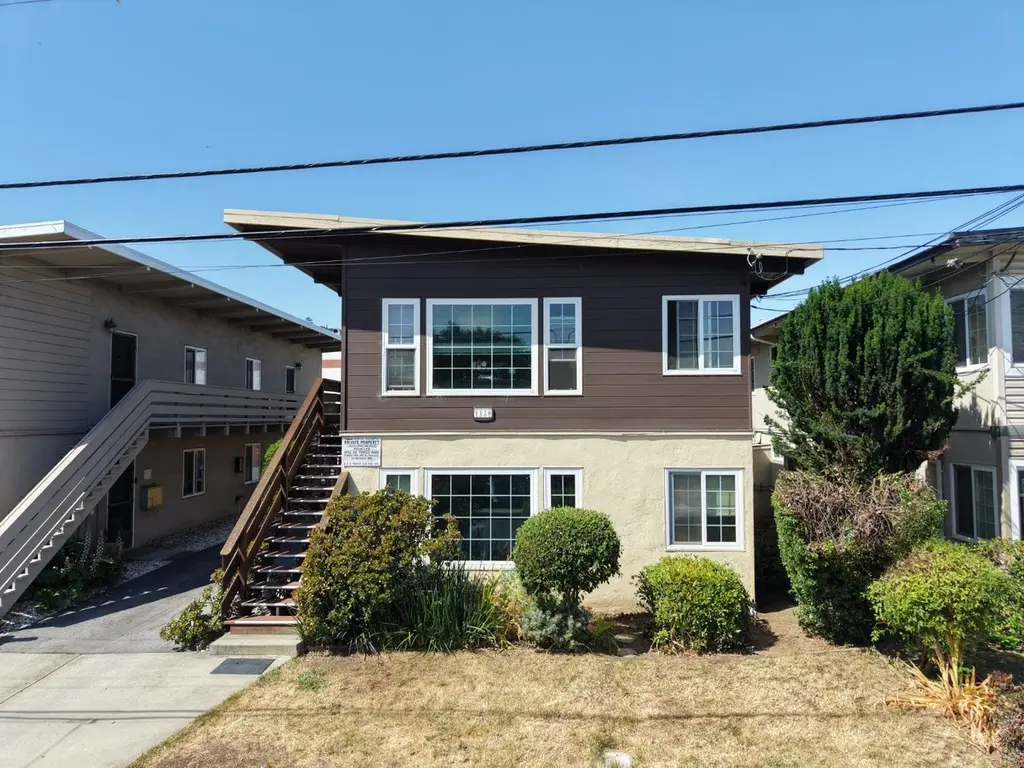
1120 Elmer St
Belmont, CA 94002
$1,680,000D
4 bd · 4.0 ba ·
2,516 sqft ·
Built 1953
· MultiFamily
· Active
· 1 DOM
Cashflow @ list (25.0% down · 7.5%)
Estimated rent
$12,001/mo
Mortgage (P&I)
−$8,810
Tax + insurance
−$2,550
HOA
−$0
Vac / Maint / Mgmt
−$2,520
Net cashflow
$-1,880/mo
Annual
$-22,555/yr
Cap rate
4.95%
Cash-on-cash
-4.79%
DSCR
0.79
1% rule
0.71%
Cash to close
$470,400
Investor read
- This is a 4 × 1-bed/1.0-bath units multifamily listed at $1.68M.
- At list price, monthly cash flow is $-2k ($-23k/yr) — negative. Per door: $-470/mo.
- To cash-flow at today's rent, offer at most $1.35M (19.8% below list).
- To meet the 1% rule (rent ≥ 1% of price), the offer needs to be $1.20M (28.6% below list).
- Only 1 days on market — expect competitive offers; lowballing is unlikely to land.
- Recommended offer: $1.20M (28.6% below list) — sets the bar for 1% rule.
- In year one you build about $116k of equity ($12k loan paydown + $105k appreciation (6.2% local appreciation)).
- Location reads 82/100 on livability (#28 in CA, #1,062 nationally) — a professional / high-income tenant draw. Strengths: schools A+, commute A+, employment A+; Watch: cost of living F.
- Belmont-Redwood Shores Elementary (suburban): math 75% / reading 80% proficiency, ranked #25 of 517 in CA (top 5%) — strong family-tenant draw, lease renewals of 3-5y typical; only 6% free/reduced lunch — higher-income household profile.
- Watch-outs: built in 1953 — expect roof / HVAC / electrical / plumbing capex.
- Market conditions: Rents rising fast (+4.6%/yr); 66 active listings in the ZIP; 3 comparable units currently listed for rent nearby; rentals leasing fast (median 2d on market — plan ~1-2 weeks tenant-placement turnaround); high-income renter base; 1,019 units permitted in San Mateo County in 2024 (484 in 5+ unit buildings).
- San Mateo County population projected at +24% by 2050 — long-run rental-demand tailwind backs the buy-and-hold thesis.
- 5 sale attempts since 3y ago with the ask held roughly flat each time — persistent listings suggest the price (not the market) is what's stuck; bring a comps-based counter.
- Current owner paid $1.43M; 17% above their basis — modest negotiation headroom, anchor on the comps not their cost.
- By year 2, paydown + projected appreciation supports a ~$186k cash-out refi (75% LTV) — recoverable capital for the next deal without selling this one.
- Cap rate 5.0% vs local median 0.7% in Belmont — top-decile yield for the area; either an underpriced asset or a hidden risk that comps aren't pricing in. Stress-test before assuming the spread holds.
- At $12,001/mo this rent would consume 71% of the median local household income ($204k/yr) (locally 939% of renters already pay >50% of income on rent) — very limited rent-growth headroom before tenants either downsize or default.
Questions for listing agent
- What do current leases actually rent for vs. the listed asking? Can we see a recent rent roll and the last 12 months of T-12 income?
- Can we see the unit-by-unit rent roll, current vacancy, and any below-market leases? What's the average tenancy length?
- What capital expenditures (roof, boiler, parking lot, exteriors) have been made in the last 5 years, and what's planned in the next 2?
- Built in 1953 — when were the roof, HVAC, electrical panel, plumbing, and water heater last replaced?
- Is there a deadline driving the sale (1031 exchange, divorce, estate, relocation)? That informs how much negotiation room exists.
- Schools are A-rated — typically a magnet for longer-tenancy family renters. What's the average tenant stay here, and is there a school-zone premium baked into asking?
- The area grade is low — what's the realistic commute time and amenity access for the typical tenant pool here? Any planned neighborhood developments (good or bad) we should know about?
- What's the average days-on-market for RENTAL listings here right now (not sales)? A rising rental-DOM trend means longer vacancies and softer asking-rent achievability than the comps imply.
CashFlowRE · CFR-0S8TFWFCQ4P9RJ
· Data 2 days ago
cashflowre.app · 2026-05-29