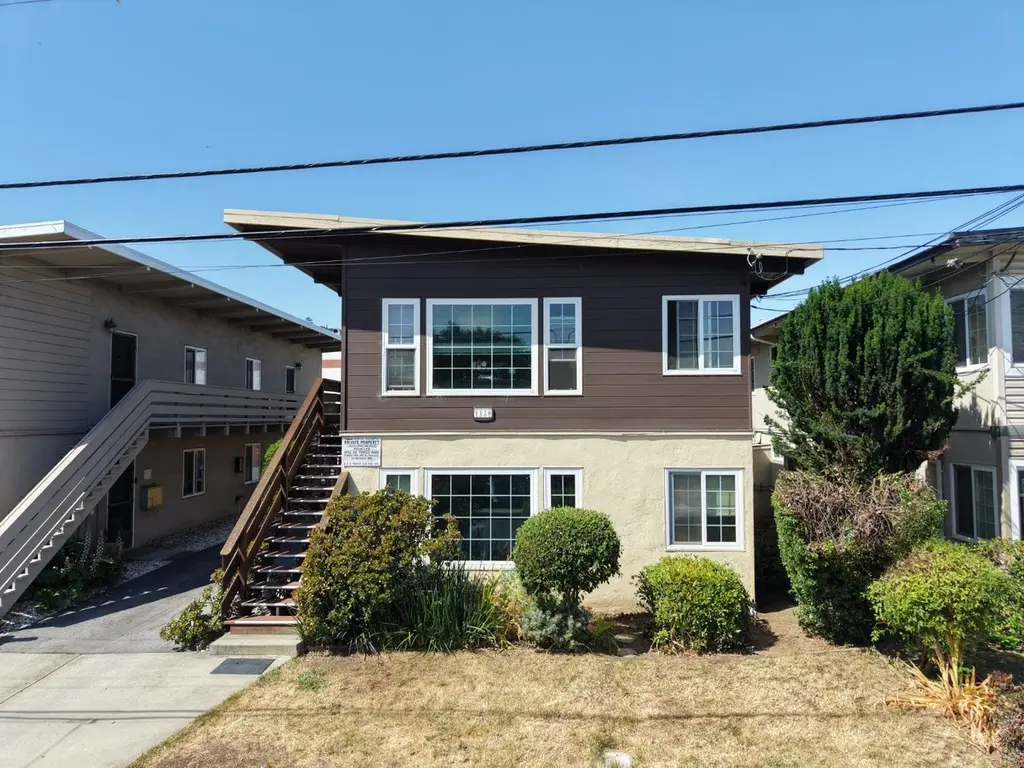
 Fourplex
1120 Elmer St · Belmont, CA
Flood risk 1/10 · Minimal
- FEMA flood zone
- X (shaded)
- Chance of flooding over 30 yrs
- 0.0%
- Est. flood insurance / yr
- $507 – $1,088
Fire risk 1/10 · Minimal
- Est. fire insurance / yr
- $659 – $1,223
Heat risk 2/10 · Minimal
- Hot days now (above 92°F)
- 7 days/yr
- Hot days in 30 yrs
- 15 days/yr
Wind risk 1/10 · Minimal
- Chance of severe wind over 30 yrs
- —
Air-quality risk 7/10 · Major
- Unhealthy air days now
- 12 days/yr
- Unhealthy air days in 30 yrs
- 12 days/yr
Risk factors via First Street. Map © Google.
Why this score? — see what drove the D grade
The composite is a weighted blend of 9 inputs, each scored 0–100. Each bar is that input's sub-score; the figure is the points it added to the 100-point composite (weight × sub-score).
- Appreciation +8.1/10.0
- Cash flow +7.8/30.0
- ARV discount +7.5/15.0
- Schools +7.2/10.0
- Livability +4.1/5.0
- Rent growth +3.6/5.0
- Condition / age +2.5/5.0
- 1% rule +2.1/10.0
- DSCR +1.9/10.0
$1,680,000
🖨 Deal sheet 📄 Offer letter ✓ Due diligence
Multi-family units
County records classify this as Multi-Family (2-4 Unit). Listing-text estimate: 4 units. confirmed
Listing remarks MLS
Incredible opportunity to acquire a rarely available Fourplex in downtown Belmont that offers significant add-value for a new owner, with one unit already vacant and another coming vacant soon. Renovate and achieve top market rents immediately! (4) One-Bedroom / One-Bath Units. Newly upgraded electrical system and new sewer lateral piping installed ($22k). Individual water heaters. Walking distance to Belmont Caltrain Station and Belmont Village Shopping Center. Walk Score: 88 (Very Walkable). Surrounded by major Life Science & Biotech Development Projects estimated to deliver 13,000 employees - high paying research, tech & life science jobs - potential future tenants! Close proximity to highly ranked schools including Carlmont High School (10/10 Rating). Ideal for owner-occupiers, value-add multifamily investors, small syndicators, 1031 exchange buyers, life-science workforce housing, and family offices.
Key facts
- 4,748 sq ft lot
- Built 1953
Property features AI
Finance
- Other: Meters: Separate electric and separate gas
- Financial info: Annual rental income: $100,872; Annual gross income: $97,846; Gross scheduled income: $100,872; Total expenses: $35,983; Vacancy factor: 3%; Gross rent multiplier: 16.65; Tenant-paid utilities include electric and gas; Reported landscape expense: $1,200; Reported trash expense: $1,920; Reported utility expenses: $2,320
Exterior
- Parking: Carport parking (4 spaces)
- Security: Security lights
- Utilities: Public water; Sewer (public); Individual electric meters; Individual gas meters
- Home design: Multi-unit building with 4 units in 1 building; 2 stories
- Construction: Concrete slab foundation; Flat/low pitch roof
- Exterior features: Flat/low pitch roof; Concrete slab foundation; Security lights; Landscape expense reported (annual)
Interior
- Kitchen: No kitchen appliance details provided
- Bedrooms: Four 1-bedroom units (each unit listed as 1 bedroom)
- Bathrooms: Four full bathrooms (one per unit)
- Heating & cooling: Gas heating; Wall furnace
- Interior features: Security lights; Separate tenant-paid utilities for electric and gas
- Laundry & utility: Individual electric meters; Individual gas meters
Neighborhood map
What this means for you Summary
Snapshot
- This is a 4 × 1-bed/1.0-bath units multifamily listed at $1.68M.
Deal economics
- At list price, monthly cash flow is $-2k ($-23k/yr) — negative. Per door: $-470/mo.
- To cash-flow at today's rent, offer at most $1.35M (19.8% below list).
- To meet the 1% rule (rent ≥ 1% of price), the offer needs to be $1.20M (28.6% below list).
- Recommended offer: $1.20M (28.6% below list) — sets the bar for 1% rule.
- Cap rate 5.0% vs local median 0.7% in Belmont — top-decile yield for the area; either an underpriced asset or a hidden risk that comps aren't pricing in. Stress-test before assuming the spread holds.
Location & tenants
- Location reads 82/100 on livability (#28 in CA, #1,062 nationally) — a professional / high-income tenant draw. Strengths: schools A+, commute A+, employment A+; Watch: cost of living F.
- Belmont-Redwood Shores Elementary (suburban): math 75% / reading 80% proficiency, ranked #25 of 517 in CA (top 5%) — strong family-tenant draw, lease renewals of 3-5y typical; only 6% free/reduced lunch — higher-income household profile.
- Market conditions: Rents rising fast (+4.6%/yr); 66 active listings in the ZIP; 3 comparable units currently listed for rent nearby; rentals leasing fast (median 2d on market — plan ~1-2 weeks tenant-placement turnaround); high-income renter base; 1,019 units permitted in San Mateo County in 2024 (484 in 5+ unit buildings).
- At $12,001/mo this rent would consume 71% of the median local household income ($204k/yr) (locally 939% of renters already pay >50% of income on rent) — very limited rent-growth headroom before tenants either downsize or default.
Forward outlook
- In year one you build about $116k of equity ($12k loan paydown + $105k appreciation (6.2% local appreciation)).
- San Mateo County population projected at +24% by 2050 — long-run rental-demand tailwind backs the buy-and-hold thesis.
- By year 2, paydown + projected appreciation supports a ~$186k cash-out refi (75% LTV) — recoverable capital for the next deal without selling this one.
Negotiation context
- Only 1 days on market — expect competitive offers; lowballing is unlikely to land.
- 5 sale attempts since 3y ago with the ask held roughly flat each time — persistent listings suggest the price (not the market) is what's stuck; bring a comps-based counter.
- Current owner paid $1.43M; 17% above their basis — modest negotiation headroom, anchor on the comps not their cost.
Risks & watch-outs
- Watch-outs: built in 1953 — expect roof / HVAC / electrical / plumbing capex.
Questions for the listing agent
- What do current leases actually rent for vs. the listed asking? Can we see a recent rent roll and the last 12 months of T-12 income?
- Can we see the unit-by-unit rent roll, current vacancy, and any below-market leases? What's the average tenancy length?
- What capital expenditures (roof, boiler, parking lot, exteriors) have been made in the last 5 years, and what's planned in the next 2?
- Built in 1953 — when were the roof, HVAC, electrical panel, plumbing, and water heater last replaced?
- Is there a deadline driving the sale (1031 exchange, divorce, estate, relocation)? That informs how much negotiation room exists.
- Schools are A-rated — typically a magnet for longer-tenancy family renters. What's the average tenant stay here, and is there a school-zone premium baked into asking?
- The area grade is low — what's the realistic commute time and amenity access for the typical tenant pool here? Any planned neighborhood developments (good or bad) we should know about?
- What's the average days-on-market for RENTAL listings here right now (not sales)? A rising rental-DOM trend means longer vacancies and softer asking-rent achievability than the comps imply.
- What's the recent tenant-quality profile in this submarket — average credit score on applications, eviction rate, late-payment / NSF rate, and stable-employment percentage? A property-management company in the area should have these aggregated.
- How much new apartment / multifamily construction is in the pipeline within 1–3 miles? Heavy new supply (>2% of stock underway) typically softens rents 12–24 months out; light construction supports rent growth.
Investment metrics
- 1% rule
- 0.71% ✗
- Cap rate
- 4.95%
- Cash-on-cash
- -4.79%
- DSCR
- 0.79
- GRM
- 11.7
CMA / ARV
No comps found within radius.
Projected returns pro-forma
6.23% appreciation · 4.56% rent growth · sell at horizon
- IRR
- 12.6%
- Equity multiple
- 1.87×
- Total profit
- $407,274
- Equity at exit
- $1,080,344
- IRR
- 13.7%
- Equity multiple
- 3.82×
- Total profit
- $1,327,431
- Equity at exit
- $1,980,409
Cash invested: $470,400 (down + closing). Projections, not guarantees.
Landlord ↔ Tenant lean methodology
- Overall (STATE)
- 18 Strongly Tenant-Friendly
- State California
- 18 Strongly Tenant-Friendly · D+13
- County
- — inherits STATE
- City
- — inherits STATE
ZIP-level market 94002
- Home prices YoY
- 1.7%
- Rents YoY
- 4.6%
- Active inventory
- 66
- Price-to-rent
- 46.7×
Monthly cashflow live
- Estimated rent
- $12,001 high interval (Pro) →
- Mortgage (P&I)
- −$8,810
- Tax from tax record
- −$1,850 /mo · $22,203/yr
- Insurance
- −$700
- HOA
- −$0
- Vacancy / Maint / Mgmt
- −$2,520
- Net cashflow
- $-1,880
Break-even live
4-unit breakdown (identical units grouped — click to expand)
| Units | Beds | Baths | Est. rent |
|---|---|---|---|
| 4× units | 1 | 1 | $12,000 |
| #1 | 1 | 1 | $3,000 |
| #2 | 1 | 1 | $3,000 |
| #3 | 1 | 1 | $3,000 |
| #4 | 1 | 1 | $3,000 |
| Total (4 units) | $12,001 | ||
UW: 25.0% down · 7.5% · 30yr · 1.5% tax · 5.0% vac · 8.0% maint · 8.0% mgmt
Financing live
Cash to close
- Down payment
- $420,000
- Closing costs
- $50,400
- Reserves months
- —
- Total cash needed
- —
Loan-product check · same deal, 3 products live
Conventional
25% down · 7.5% · 30yr
- Down + closing
- —
- Monthly P&I
- —
- Monthly cashflow
- —
- DSCR
- —
- Eligible?
- —
Personal DTI + credit; lowest rate.
DSCR
20% down · 8.5% · 30yr
- Down + closing
- —
- Monthly P&I
- —
- Monthly cashflow
- —
- DSCR
- —
- Eligible?
- —
No personal income docs; deal must DSCR.
Hard money
10% down · 12.0% · 12mo
- Down + closing
- —
- Monthly P&I
- —
- Monthly cashflow
- —
- DSCR
- —
- Eligible?
- —
Short-term bridge; refi at stabilization.
Rent comps 3 comps
| Address | Beds | Baths | Sqft | Rent | $/sqft | DOM | Units | Dist |
|---|---|---|---|---|---|---|---|---|
| 1129 Vailwood Way San Mateo, CA | 4.0 | 3.0 | 2510 | $6,375 | $2.54 | 1d | 1 | 0.80mi |
| 321 Quay Ln Redwood City, CA | 3.0 | 2.5 | 2042 | $6,750 | $3.31 | 17d | 1 | 0.97mi |
| 70 Adam Ct San Carlos, CA | 5.0 | 3.5 | 3200 | $10,500 | $3.28 | 1d | 1 | 1.31mi |
Listing history 2 events
-
2026-06-18remarks 691-char remark
Show marketing remark (926 chars)
Incredible opportunity to acquire a rarely available Fourplex in downtown Belmont that offers significant add-value for a new owner, with one unit already vacant and another coming vacant soon. Renovate and achieve top market rents immediately! (4) One-Bedroom / One-Bath Units. Newly upgraded electrical system and new sewer lateral piping installed ($22k). Individual water heaters. Walking distance to Belmont Caltrain Station and Belmont Village Shopping Center. Walk Score: 88 (Very Walkable). Surrounded by major Life Science & Biotech Development Projects estimated to deliver 13,000 employees - high paying research, tech & life science jobs - potential future tenants! Close proximity to highly ranked schools including Carlmont High School (10/10 Rating). Ideal for owner-occupiers, value-add multifamily investors, small syndicators, 1031 exchange buyers, life-science workforce housing, and family offices.
-
2026-06-18$1,680,000 Active 1 DOM
Show marketing remark (926 chars)
Incredible opportunity to acquire a rarely available Fourplex in downtown Belmont that offers significant add-value for a new owner, with one unit already vacant and another coming vacant soon. Renovate and achieve top market rents immediately! (4) One-Bedroom / One-Bath Units. Newly upgraded electrical system and new sewer lateral piping installed ($22k). Individual water heaters. Walking distance to Belmont Caltrain Station and Belmont Village Shopping Center. Walk Score: 88 (Very Walkable). Surrounded by major Life Science & Biotech Development Projects estimated to deliver 13,000 employees - high paying research, tech & life science jobs - potential future tenants! Close proximity to highly ranked schools including Carlmont High School (10/10 Rating). Ideal for owner-occupiers, value-add multifamily investors, small syndicators, 1031 exchange buyers, life-science workforce housing, and family offices.
ⓘ Source: listings_history table (triggers on properties + properties_extension) + one-shot
backfill from property_details.listing_events for pre-trigger history.
Tax reassessment forecast CA · Resets to sale price
- Current annual tax
- $22,203 · $1,850/mo
- Projected year-2 tax
- $22,203 · $1,850/mo
- Expected delta
- $0/yr ($0/mo · 0.0%)
ⓘ Screening estimate from a state-policy table — verify with the county assessor before closing.
Climate risk First Street
- Flood 1/10 Low FEMA zone X (shaded) · 0% chance over 30 yrs
- Wildfire 1/10 Low
- Heat 2/10 Low 7 d/yr ≥92°F today · 15 d/yr by 30 yrs out
- Wind 1/10 Low
- Air quality 7/10 Severe 12 unhealthy d/yr today · 12 by 30 yrs out
Nearby sold comps map
Loading sold comps map…
Walkable amenities ~0.75 mi
Loading nearby amenities…
Taxation est. · year 1
- Rental income
- $144,012
- − Mortgage interest
- −$94,106
- − Property taxes
- −$22,203
- − Insurance
- −$8,400
- − Repairs & maintenance
- −$11,521
- − Management
- −$11,521
- − Depreciation
- −$48,873
- Taxable loss
- −$52,612
- Est. tax savings @ 24.0%
- +$12,627
- After-tax cash flow
- $-9,928/yr
For passive investors: Depreciation is non-cash, so a rental often shows a tax loss while cash-flowing — sheltering income. Rental losses are passive: they offset passive income freely, and up to $25,000/yr can offset ordinary (W-2) income if you actively participate and your MAGI is under $100k (phasing out to $0 by $150k); unused losses carry forward. On sale, claimed depreciation is recaptured at up to 25%, and gains may owe capital-gains tax (a 1031 exchange can defer both). Figures are a year-1 estimate at your 24.0% rate — not tax advice; consult a CPA.
Schools (NCES district)
- District
- Belmont-Redwood Shores Elementary
- NCES district ID
- 0604530
- Math proficiency
- 75% ▼ -4.00%
- Reading proficiency
- 80% ▼ -2.00%
- Median HH income
- $116,616
- Composite
- 71.94/100
- National rank
- #212
- State rank
- #25 of 517 in CA
Livability — Belmont
- Score
- 82/100
- State rank
- #28
- US rank
- #1062
Category grades
Schools grade is shown separately in the Schools card above.
Census & demographics
- Census place
- Belmont, CA
- County
- San Mateo County · 733,415 people
- City population
- 27,534
- Metro
- San Francisco-Oakland-Berkeley, CA
- Population (ZIP)
- 27,534
- Household income
- $203,965
- Rent vs Own
- Severe rent burden
- 939.0
Population outlook (San Mateo County) Hauer SSP2
- Today (2025)
- 864,008 people
- By 2030
- 910,523 · +5.4%
- By 2040
- 997,285 · +15.4%
- By 2050
- 1,071,189 · +24.0%
- By 2075
- 1,197,206 · +38.6%
- By 2100
- 1,192,523 · +38.0%
Race, ethnicity, and origin ACS 2023
- Neighborhood character
- Diverse neighborhood (Simpson 0.68)
- Race & ethnicity
- White 46% Asian 29% Hispanic / Latino 14% Two or more races 10% Black 2% Pacific Islander 1%
- Hispanic origin (detail)
- Mexican 6%
- Common ancestry
- Lithuanian 3% Slovak 2% Scotch-Irish 2%
- Foreign-born
- 31% · China, Canada, Vietnam
- Languages at home
- 62% English-only · Spanish 10% Chinese 9% Other Indo-European 6%
Political lean MEDSL · San Mateo
- 2024 margin
- Solid D (+50.3) · D 73.5% · R 23.2% · Other 3.3%
- 2008→2024 swing
- +1.6pp toward D · 2008: 48.7pp · 2024: 50.3pp
- All cycles
- 2024: D+50.3 2020: D+57.7 2016: D+57.7 2012: D+44.8 2008: D+48.7
Not yet ingested
- Civics
- —
Market trends
- HPI YoY
- ▲ 6.23%
- Current HPI
- 376.2038
- Rent YoY
- ▲ 4.56%
- Metro
- San Francisco-Oakland-Berkeley, CA
- State GDP YoY
- ▲ 3.21%
- F500 in state
- 116
Industry mix (Fortune 500 HQ in CA)
| Industry | F500 HQs | Revenue |
|---|---|---|
| Technology | 27 | $1,492B |
|
||
| Financial Services | 3 | $174B |
|
||
| Retail | 3 | $44B |
|
||
| Insurance | 3 | $26B |
|
||
| Media / Entertainment | 2 | $115B |
|
||
| Pharmaceuticals / Biotech | 2 | $62B |
|
||
Price history
+86053.8% since first listed13 events — show timeline
- 2026-06-18 Listed $1,680,000 MLSListings
- 2026-06-18 Listed $1,680,000 bridgeMLS, Bay East AOR, or Contra Costa AOR
- 2024-01-22 Sold (Public Records) $1,430,000 Public Records
- 2024-01-22 Sold (MLS) $1,430,000 bridgeMLS, Bay East AOR, or Contra Costa AOR
- 2024-01-22 Sold (MLS) $1,430,000 MLSListings
- 2023-12-14 Pending — MLSListings
- 2023-11-07 Relisted — MLSListings
- 2023-11-04 Contingent — MLSListings
- 2023-10-21 Price Changed $1,598,000 MLSListings
- 2023-10-21 Price Changed $998,000 MLSListings
- 2023-09-30 Listed $1,598,000 bridgeMLS, Bay East AOR, or Contra Costa AOR
- 2023-09-30 Listed $1,598,000 MLSListings
- 2022-04-02 Price Changed $1,950 RENT.
Property tax history
+7.5%/yrLatest (2025): $22,203 · +82.2% YoY. Source: county tax records.
Cash-flow waterfall
monthlySold comps — $/sqft
last 12 mo · ≤1 miLoading sold comps…