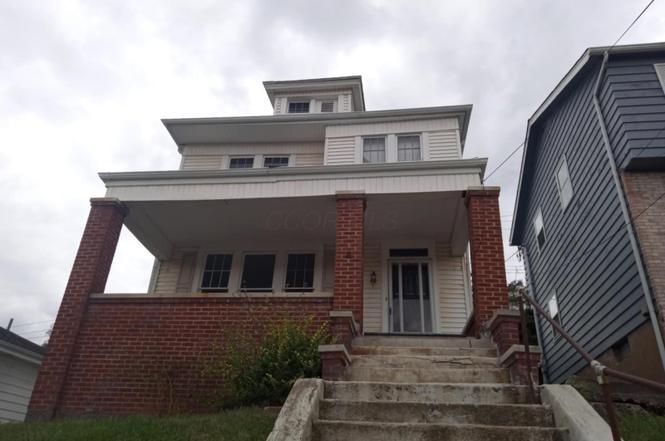
717 Elm St
Martins Ferry, OH 43935
$68,000B
3 bd · 1.0 ba ·
1,412 sqft ·
Built 1900
· SingleFamily
· Pending
· 84 DOM
Cashflow @ list (25.0% down · 7.5%)
Estimated rent
$1,500/mo
Mortgage (P&I)
−$357
Tax + insurance
−$53
HOA
−$0
Vac / Maint / Mgmt
−$315
Net cashflow
$775/mo
Annual
$9,305/yr
Cap rate
19.98%
Cash-on-cash
48.87%
DSCR
3.17
1% rule
2.21%
Cash to close
$19,040
Investor read
- This is a 3-bed/1.0-bath single-family listed at $68k.
- At list price, monthly cash flow is $775 ($9k/yr) — positive.
- The deal already cash-flows at list — no discount required.
- Meets the 1% rule at list price ($2k rent vs $68k).
- It's been on market 84 days — a 6% lower offer ($64k) is reasonable based on typical stale-listing flexibility.
- Recommended offer: $64k (6.0% below list) — sets the bar for market timing.
- Local home prices are declining (-3.0%/yr); year-one equity from $470 of loan paydown is wiped out by about $2k of value loss. Plan a longer hold.
- Location reads 71/100 on livability (#423 in OH) — a middle-class / working-renter tenant base. Strengths: cost of living A+, housing A+, health & safety A-; Watch: amenities F, commute F, employment F.
- Martins Ferry City (suburban): math 42% / reading 54% proficiency, ranked #483 of 656 in OH (top 74%) — families likely to look elsewhere, expect single-tenant / working-renter base with shorter leases; 61% free/reduced lunch — lower-income household profile, screen leases tightly.
- Watch-outs: built in 1900 — expect roof / HVAC / electrical / plumbing capex.
- Market conditions: 32 active listings in the ZIP; 1 comparable units currently listed for rent nearby; 4 units permitted in Belmont County in 2024 (0 in 5+ unit buildings).
- Belmont County population projected at -15% by 2050 — secular population decline; favor cash flow + early exit over multi-decade hold.
- 5 sale attempts since 16y ago; this cycle's ask has dropped $22k (24%) from the opening price — seller is motivated, your offer sets the floor, not the list.
- Current owner paid $1k; list at $68k implies a 5506% gain — meaningful room to come down on a strong offer.
- At projected returns (-3.0% appreciation + 3.0% rent growth), your $19k cash investment doubles in ~3 years — after that, you're playing with house money.
- Cap rate 20.0% vs local median 8.3% in Martins Ferry — top-decile yield for the area; either an underpriced asset or a hidden risk that comps aren't pricing in. Stress-test before assuming the spread holds.
- This rent runs 36% of the median local income ($50k/yr) — at the standard rent-burdened threshold; future hikes will face affordability resistance.
Questions for listing agent
- It's been on market 84 days. Have you received any prior offers? Is the seller open to a 6% concession, seller financing, or rate buy-down credit?
- Built in 1900 — when were the roof, HVAC, electrical panel, plumbing, and water heater last replaced?
- Why hasn't it sold? Are there any deal-killer items the seller is aware of (foundation, flood, title, zoning, code violations)?
- Is there a deadline driving the sale (1031 exchange, divorce, estate, relocation)? That informs how much negotiation room exists.
- Schools are B-rated — typically a magnet for longer-tenancy family renters. What's the average tenant stay here, and is there a school-zone premium baked into asking?
- What's the average days-on-market for RENTAL listings here right now (not sales)? A rising rental-DOM trend means longer vacancies and softer asking-rent achievability than the comps imply.
- What's the recent tenant-quality profile in this submarket — average credit score on applications, eviction rate, late-payment / NSF rate, and stable-employment percentage? A property-management company in the area should have these aggregated.
- How much new for-sale + rental construction is in the pipeline within 1–3 miles? Heavy new supply typically softens prices + rents 12–24 months out; constrained supply supports both.
CashFlowRE · CFR-0T746CF95SF07S
· Data 3 weeks ago
cashflowre.app · 2026-05-29