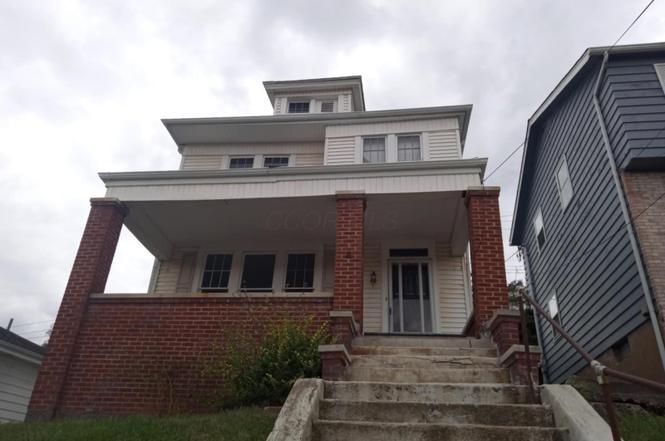
717 Elm St · Martins Ferry, OH
Flood risk 1/10 · Minimal
- FEMA flood zone
- X (unshaded)
- Chance of flooding over 30 yrs
- 0.0%
- Est. flood insurance / yr
- $473 – $860
Fire risk 1/10 · Minimal
- Est. fire insurance / yr
- $713 – $1,323
Heat risk 4/10 · Minor
- Hot days now (above 98°F)
- 7 days/yr
- Hot days in 30 yrs
- 20 days/yr
Wind risk 1/10 · Minimal
- Chance of severe wind over 30 yrs
- —
Air-quality risk 2/10 · Minimal
- Unhealthy air days now
- 1 days/yr
- Unhealthy air days in 30 yrs
- 2 days/yr
Risk factors via First Street. Map © Google.
Why this score? — see what drove the B grade
The composite is a weighted blend of 9 inputs, each scored 0–100. Each bar is that input's sub-score; the figure is the points it added to the 100-point composite (weight × sub-score).
- Cash flow +30.0/30.0
- 1% rule +10.0/10.0
- DSCR +10.0/10.0
- ARV discount +7.5/15.0
- Schools +4.0/10.0
- Livability +3.6/5.0
- Rent growth +2.5/5.0
- Condition / age +2.5/5.0
- Appreciation +0.0/10.0
$68,000
🖨 Deal sheet 📄 Offer letter ✓ Due diligence
Listing remarks MLS
THE HIGHEST BID OVER $500 BUYS THIS PROPERTY. Single family home located in Martins Ferry Ohio. According to public record this Single family home has 3 bedrooms and 1 bath. Sold AS-IS. Seller, in its sole discretion or through its agent, reserves the right to place, accept or reject any bid / offer at any time without notice. Up to buyer to verify all information, No reps, no warranties. All information thought to be correct but not guaranteed. $500 deposit due w/ in 24 hrs of bidding. CASH ONLY. NO contingencies of any kind will be permitted. The buyer will need to close within 30 days of bidding end. If the buyer does not close on time, for any reason, they will lose their $500 deposit. 10% Buyer Premium is added to the high bid to determine the final sales price. Property is sold 100% AS-IS, WHERE-IS. Seller is not paying any tax pro-rations or delinquent taxes. Property is sold subject to any/all code violations. Seller reserves the right to accept or reject any bid or offer, at any time prior to or subsequent to bidding end, for any reason. Information contained in any advertisement is not guaranteed or warranted. No contingencies will be accepted, except the Seller’s ability to convey insurable title. Cash sale only, absolutely no financing contingencies. Absolutely no inspection contingencies. 10% Buyer’s Premium is added to the high acceptable bid to determine the final sale price.
Key facts
- 3,920 sq ft lot
- Garage
- Built 1900
Neighborhood map
What this means for you Summary
Snapshot
- This is a 3-bed/1.0-bath single-family listed at $68k.
Deal economics
- At list price, monthly cash flow is $775 ($9k/yr) — positive.
- The deal already cash-flows at list — no discount required.
- Meets the 1% rule at list price ($2k rent vs $68k).
- Recommended offer: $64k (6.0% below list) — sets the bar for market timing.
- Cap rate 20.0% vs local median 8.3% in Martins Ferry — top-decile yield for the area; either an underpriced asset or a hidden risk that comps aren't pricing in. Stress-test before assuming the spread holds.
Location & tenants
- Location reads 71/100 on livability (#423 in OH) — a middle-class / working-renter tenant base. Strengths: cost of living A+, housing A+, health & safety A-; Watch: amenities F, commute F, employment F.
- Martins Ferry City (suburban): math 42% / reading 54% proficiency, ranked #483 of 656 in OH (top 74%) — families likely to look elsewhere, expect single-tenant / working-renter base with shorter leases; 61% free/reduced lunch — lower-income household profile, screen leases tightly.
- Market conditions: 32 active listings in the ZIP; 1 comparable units currently listed for rent nearby; 4 units permitted in Belmont County in 2024 (0 in 5+ unit buildings).
- This rent runs 36% of the median local income ($50k/yr) — at the standard rent-burdened threshold; future hikes will face affordability resistance.
Forward outlook
- Local home prices are declining (-3.0%/yr); year-one equity from $470 of loan paydown is wiped out by about $2k of value loss. Plan a longer hold.
- Belmont County population projected at -15% by 2050 — secular population decline; favor cash flow + early exit over multi-decade hold.
- At projected returns (-3.0% appreciation + 3.0% rent growth), your $19k cash investment doubles in ~3 years — after that, you're playing with house money.
Negotiation context
- It's been on market 84 days — a 6% lower offer ($64k) is reasonable based on typical stale-listing flexibility.
- 5 sale attempts since 16y ago; this cycle's ask has dropped $22k (24%) from the opening price — seller is motivated, your offer sets the floor, not the list.
- Current owner paid $1k; list at $68k implies a 5506% gain — meaningful room to come down on a strong offer.
Risks & watch-outs
- Watch-outs: built in 1900 — expect roof / HVAC / electrical / plumbing capex.
Questions for the listing agent
- It's been on market 84 days. Have you received any prior offers? Is the seller open to a 6% concession, seller financing, or rate buy-down credit?
- Built in 1900 — when were the roof, HVAC, electrical panel, plumbing, and water heater last replaced?
- Why hasn't it sold? Are there any deal-killer items the seller is aware of (foundation, flood, title, zoning, code violations)?
- Is there a deadline driving the sale (1031 exchange, divorce, estate, relocation)? That informs how much negotiation room exists.
- Schools are B-rated — typically a magnet for longer-tenancy family renters. What's the average tenant stay here, and is there a school-zone premium baked into asking?
- What's the average days-on-market for RENTAL listings here right now (not sales)? A rising rental-DOM trend means longer vacancies and softer asking-rent achievability than the comps imply.
- What's the recent tenant-quality profile in this submarket — average credit score on applications, eviction rate, late-payment / NSF rate, and stable-employment percentage? A property-management company in the area should have these aggregated.
- How much new for-sale + rental construction is in the pipeline within 1–3 miles? Heavy new supply typically softens prices + rents 12–24 months out; constrained supply supports both.
Investment metrics
- 1% rule
- 2.21% ✓
- Cap rate
- 19.98%
- Cash-on-cash
- 48.87%
- DSCR
- 3.17
- GRM
- 3.8
CMA / ARV
- ARV (on-the-fly)
- $153,908
- Comps found
- 12
Show comp detail 12 sales within ~0.75 mi
| Address | Dist | Beds/Ba | Sqft | Sold | Price | $/sf | Match |
|---|---|---|---|---|---|---|---|
| 710 Washington St | 0.12mi | 3/1.0 | 1,408 (-0%) | 3mo | $50,000 | $36 | 92 |
| 607 W Vine St | 0.11mi | 3/1.0 | 1,300 (-8%) | 5mo | $142,000 | $109 | 78 |
| 1028 Indiana St | 0.41mi | 3/1.0 | 1,294 (-8%) | 6mo | $130,000 | $100 | 62 |
| 109 N 8th St | 0.53mi | 3/2.0 | 1,404 (-1%) | 10mo | $156,500 | $111 | 62 |
| 7 Willeta Ave | 0.15mi | 3/2.0 | 1,224 (-13%) | 7mo | $169,000 | $138 | 61 |
| 1836 Colerain Pike | 0.46mi | 2/1.0 (-1) | 1,338 (-5%) | 8mo | $30,000 | $22 | 59 |
| 113 N 10th St | 0.57mi | 3/2.0 | 1,381 (-2%) | 9mo | $151,500 | $110 | 58 |
| 1202 Virginia St | 0.51mi | 3/2.0 | 1,560 (+10%) | 2mo | $180,000 | $115 | 53 |
| 19 Sunset Dr | 0.71mi | 4/2.0 (+1) | 1,404 (-1%) | 5mo | $70,000 | $50 | 53 |
| 506 S 3rd St | 0.40mi | 3/2.0 | 1,561 (+11%) | 10mo | $88,000 | $56 | 52 |
| 1027 Zane Hwy S | 0.41mi | 3/2.0 | 1,572 (+11%) | 8mo | $180,000 | $115 | 51 |
| 57365 Washington Blvd | 0.68mi | 3/2.0 | 1,205 (-15%) | 7mo | $125,000 | $104 | 34 |
Match score weights: distance 35% · size 25% · config 20% · recency 20%. Top-matched comps best support the ARV.
Projected returns pro-forma
-3.0% appreciation · 3.0% rent growth · sell at horizon
- IRR
- 46.4%
- Equity multiple
- 3.01×
- Total profit
- $38,351
- Equity at exit
- $10,139
- IRR
- 52.2%
- Equity multiple
- 6.09×
- Total profit
- $96,928
- Equity at exit
- $5,879
Cash invested: $19,040 (down + closing). Projections, not guarantees.
Landlord ↔ Tenant lean methodology
- Overall (STATE)
- 73 Landlord-Friendly
- State Ohio
- 73 Landlord-Friendly · R+6
- County
- — inherits STATE
- City
- — inherits STATE
ZIP-level market 43935
- Home prices YoY
- -12.7%
- Active inventory
- 32
- Price-to-rent
- 3.8×
Monthly cashflow live
- Estimated rent
- $1,500 medium interval (Pro) →
- Mortgage (P&I)
- −$357
- Tax from tax record
- −$25 /mo · $296/yr
- Insurance
- −$28
- HOA
- −$0
- Vacancy / Maint / Mgmt
- −$315
- Net cashflow
- $775
Break-even live
UW: 25.0% down · 7.5% · 30yr · 1.5% tax · 5.0% vac · 8.0% maint · 8.0% mgmt
Financing live
Cash to close
- Down payment
- $17,000
- Closing costs
- $2,040
- Reserves months
- —
- Total cash needed
- —
Loan-product check · same deal, 3 products live
Conventional
25% down · 7.5% · 30yr
- Down + closing
- —
- Monthly P&I
- —
- Monthly cashflow
- —
- DSCR
- —
- Eligible?
- —
Personal DTI + credit; lowest rate.
DSCR
20% down · 8.5% · 30yr
- Down + closing
- —
- Monthly P&I
- —
- Monthly cashflow
- —
- DSCR
- —
- Eligible?
- —
No personal income docs; deal must DSCR.
Hard money
10% down · 12.0% · 12mo
- Down + closing
- —
- Monthly P&I
- —
- Monthly cashflow
- —
- DSCR
- —
- Eligible?
- —
Short-term bridge; refi at stabilization.
Rent comps 1 comps
| Address | Beds | Baths | Sqft | Rent | $/sqft | DOM | Units | Dist |
|---|---|---|---|---|---|---|---|---|
| 614 N Front St Wheeling, WV | 2.0 | 1.0 | 1000 | $1,500 | $1.50 | 43d | 1 | 1.07mi |
Listing history 13 events
-
2026-02-03status Pending
-
2026-01-15price $68,000
-
2025-12-09price $70,000
-
2025-11-11$90,000 Active
-
2025-09-20historical
-
2025-08-22$95,000 Active
-
2019-11-18soldstatus $1,213 1425-char remark
Show marketing remark (1425 chars)
THE HIGHEST BID OVER $500 BUYS THIS PROPERTY. Single family home located in Martins Ferry Ohio. According to public record this Single family home has 3 bedrooms and 1 bath. Sold AS-IS. Seller, in its sole discretion or through its agent, reserves the right to place, accept or reject any bid / offer at any time without notice. Up to buyer to verify all information, No reps, no warranties. All information thought to be correct but not guaranteed. $500 deposit due w/ in 24 hrs of bidding. CASH ONLY. NO contingencies of any kind will be permitted. The buyer will need to close within 30 days of bidding end. If the buyer does not close on time, for any reason, they will lose their $500 deposit. 10% Buyer Premium is added to the high bid to determine the final sales price. Property is sold 100% AS-IS, WHERE-IS. Seller is not paying any tax pro-rations or delinquent taxes. Property is sold subject to any/all code violations. Seller reserves the right to accept or reject any bid or offer, at any time prior to or subsequent to bidding end, for any reason. Information contained in any advertisement is not guaranteed or warranted. No contingencies will be accepted, except the Seller’s ability to convey insurable title. Cash sale only, absolutely no financing contingencies. Absolutely no inspection contingencies. 10% Buyer’s Premium is added to the high acceptable bid to determine the final sale price.
-
2019-09-26$500 1425-char remark
Show marketing remark (1425 chars)
THE HIGHEST BID OVER $500 BUYS THIS PROPERTY. Single family home located in Martins Ferry Ohio. According to public record this Single family home has 3 bedrooms and 1 bath. Sold AS-IS. Seller, in its sole discretion or through its agent, reserves the right to place, accept or reject any bid / offer at any time without notice. Up to buyer to verify all information, No reps, no warranties. All information thought to be correct but not guaranteed. $500 deposit due w/ in 24 hrs of bidding. CASH ONLY. NO contingencies of any kind will be permitted. The buyer will need to close within 30 days of bidding end. If the buyer does not close on time, for any reason, they will lose their $500 deposit. 10% Buyer Premium is added to the high bid to determine the final sales price. Property is sold 100% AS-IS, WHERE-IS. Seller is not paying any tax pro-rations or delinquent taxes. Property is sold subject to any/all code violations. Seller reserves the right to accept or reject any bid or offer, at any time prior to or subsequent to bidding end, for any reason. Information contained in any advertisement is not guaranteed or warranted. No contingencies will be accepted, except the Seller’s ability to convey insurable title. Cash sale only, absolutely no financing contingencies. Absolutely no inspection contingencies. 10% Buyer’s Premium is added to the high acceptable bid to determine the final sale price.
-
2018-12-30historical
-
2018-10-01$9,500
-
2011-01-17soldstatus $36,500
-
2010-03-22$43,900
-
2000-12-29soldstatus $62,000
ⓘ Source: listings_history table (triggers on properties + properties_extension) + one-shot
backfill from property_details.listing_events for pre-trigger history.
Tax reassessment forecast OH · Partial reset (capped growth)
- Current annual tax
- $296 · $25/mo
- Projected year-2 tax
- $678 · $57/mo
- Expected delta
- +$382/yr (+$32/mo · 129.1%)
ⓘ Screening estimate from a state-policy table — verify with the county assessor before closing.
Climate risk First Street
- Flood 1/10 Low FEMA zone X (unshaded) · 0% chance over 30 yrs
- Wildfire 1/10 Low
- Heat 4/10 Moderate 7 d/yr ≥98°F today · 20 d/yr by 30 yrs out
- Wind 1/10 Low
- Air quality 2/10 Low 1 unhealthy d/yr today · 2 by 30 yrs out
Nearby sold comps map
Loading sold comps map…
Walkable amenities ~0.75 mi
Loading nearby amenities…
Taxation est. · year 1
- Rental income
- $18,000
- − Mortgage interest
- −$3,809
- − Property taxes
- −$296
- − Insurance
- −$340
- − Repairs & maintenance
- −$1,440
- − Management
- −$1,440
- − Depreciation
- −$1,978
- Taxable income
- $8,697
- Est. tax owed @ 24.0%
- −$2,087
- After-tax cash flow
- $7,217/yr
For passive investors: Depreciation is non-cash, so a rental often shows a tax loss while cash-flowing — sheltering income. Rental losses are passive: they offset passive income freely, and up to $25,000/yr can offset ordinary (W-2) income if you actively participate and your MAGI is under $100k (phasing out to $0 by $150k); unused losses carry forward. On sale, claimed depreciation is recaptured at up to 25%, and gains may owe capital-gains tax (a 1031 exchange can defer both). Figures are a year-1 estimate at your 24.0% rate — not tax advice; consult a CPA.
Schools (NCES district)
- District
- Martins Ferry City
- NCES district ID
- 3904434
- Math proficiency
- 42% ▼ -23.00%
- Reading proficiency
- 54% ▼ -9.00%
- Median HH income
- $37,566
- Composite
- 39.89/100
- National rank
- #3859
- State rank
- #483 of 656 in OH
Livability — Martins Ferry
- Score
- 71/100
- State rank
- #423
- US rank
- #6917
Category grades
Schools grade is shown separately in the Schools card above.
Census & demographics
- Census place
- Martins Ferry, OH
- County
- Belmont · 63,139 people
- Metro
- Wheeling, WV-OH
- Population (ZIP)
- 7,918
- Household income
- $50,109
- Rent vs Own
- Severe rent burden
- 2.2
Population outlook (Belmont County) Hauer SSP2
- Today (2025)
- 66,568 people
- By 2030
- 64,818 · -2.6%
- By 2040
- 60,702 · -8.8%
- By 2050
- 56,427 · -15.2%
- By 2075
- 46,222 · -30.6%
- By 2100
- 34,611 · -48.0%
Race, ethnicity, and origin ACS 2023
- Neighborhood character
- Predominantly White (84%)
- Race & ethnicity
- White 84% Two or more races 8% Black 5% Asian 3%
- Common ancestry
- Romanian 4% Serbian 1% Lithuanian 1%
- Foreign-born
- 2% · China
- Languages at home
- 98% English-only · Spanish 1% Chinese 1% German/W. Germanic 1%
Political lean MEDSL · Belmont
- 2024 margin
- Solid R (+47.3) · D 26.0% · R 73.3%
- 2008→2024 swing
- -50.0pp toward R · 2008: 2.7pp · 2024: -47.3pp
- All cycles
- 2024: R+47.3 2020: R+43.6 2016: R+39.5 2012: R+8.4 2008: D+2.7
Not yet ingested
- Civics
- —
Market trends
- HPI YoY
- ▼ -25.06%
- Current HPI
- 172.1787
- Rent YoY
- —
- Metro
- —
- State GDP YoY
- ▲ 1.98%
- F500 in state
- 48
Industry mix (Fortune 500 HQ in OH)
| Industry | F500 HQs | Revenue |
|---|---|---|
| Insurance | 3 | $145B |
|
||
| Industrial Machinery | 3 | $49B |
|
||
| Financial Services | 3 | $24B |
|
||
| Consumer Goods | 2 | $93B |
|
||
| Aerospace / Defense | 2 | $47B |
|
||
| Utilities | 2 | $33B |
|
||
Price history
+9.7% since first listed13 events — show timeline
- 2026-02-03 Pending — CBRMLS
- 2026-01-15 Price Changed $68,000 CBRMLS
- 2025-12-09 Price Changed $70,000 CBRMLS
- 2025-11-11 Listed $90,000 CBRMLS
- 2025-09-20 Listing Removed — MLSNOW
- 2025-08-22 Listed $95,000 MLSNOW
- 2019-11-18 Sold (MLS) $1,213 MLSNOW
- 2019-09-26 Listed $500 MLSNOW
- 2018-12-30 Listing Removed — MLSNOW
- 2018-10-01 Listed $9,500 MLSNOW
- 2011-01-17 Sold (MLS) $36,500 MLSNOW
- 2010-03-22 Listed $43,900 MLSNOW
- 2000-12-29 Sold (Public Records) $62,000 Public Records
Property tax history
-13.0%/yrLatest (2025): $296 · +1.4% YoY. Source: county tax records.
Cash-flow waterfall
monthlySold comps — $/sqft
last 12 mo · ≤1 miLoading sold comps…