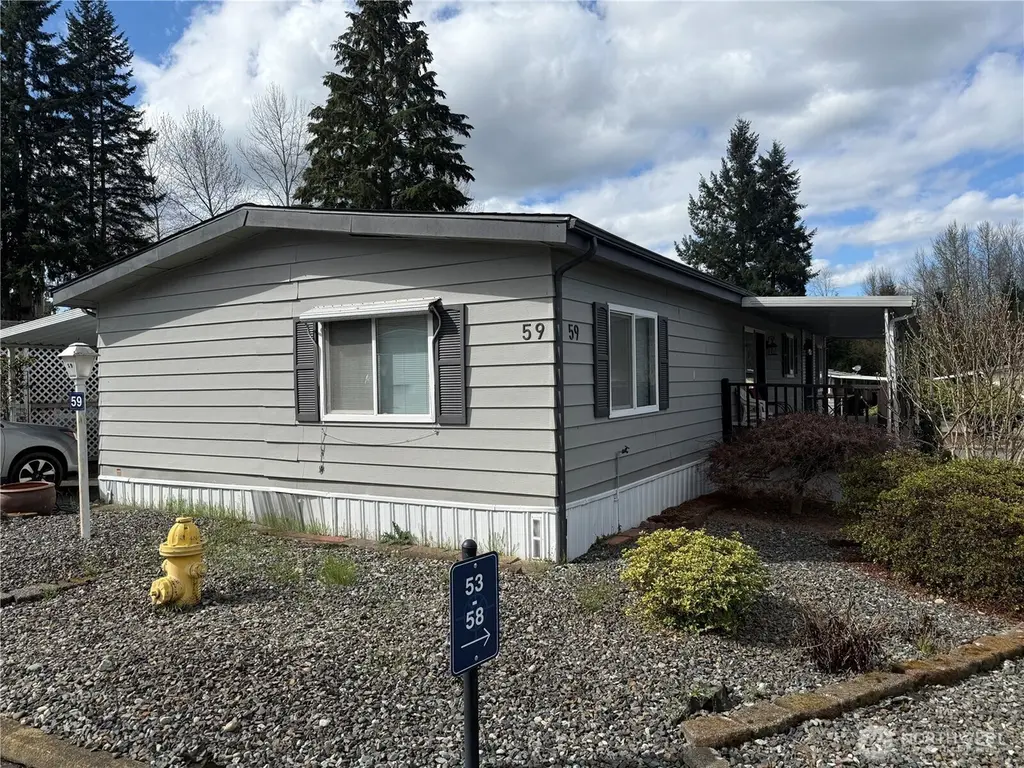
2200 196th St SE Unit #59
Bothell East, WA 98012
$39,950D+
3 bd · 2.0 ba ·
1,440 sqft ·
Built 1976
· Manufactured
· Active
· 79 DOM
Cashflow @ list (25.0% down · 7.5%)
Estimated rent
$2,987/mo
Mortgage (P&I)
−$210
Tax + insurance
−$33
HOA
−$0
Vac / Maint / Mgmt
−$627
Net cashflow
$2,117/mo
Annual
$25,405/yr
Cap rate
69.89%
Cash-on-cash
227.12%
DSCR
11.11
1% rule
7.48%
Cash to close
$11,186
Investor read
- This is a 3-bed/2.0-bath manufactured listed at $40k.
- At list price, monthly cash flow is $2k ($25k/yr) — positive.
- The deal already cash-flows at list — no discount required.
- Meets the 1% rule at list price ($3k rent vs $40k).
- It's been on market 79 days — a 6% lower offer ($38k) is reasonable based on typical stale-listing flexibility.
- Recommended offer: $38k (6.0% below list) — sets the bar for market timing.
- Local home prices are declining (-3.0%/yr); year-one equity from $276 of loan paydown is wiped out by about $1k of value loss. Plan a longer hold.
- Location reads 90/100 on livability (#5 in WA, #104 nationally) — a professional / high-income tenant draw. Strengths: schools A+, crime A+, amenities A+; Watch: cost of living F.
- Northshore School District (suburban): math 69% / reading 78% proficiency, ranked #9 of 291 in WA (top 3%) — strong family-tenant draw, lease renewals of 3-5y typical; only 12% free/reduced lunch — higher-income household profile.
- Market conditions: Rents rising (+2.4%/yr); 451 active listings in the ZIP; 29 comparable units currently listed for rent nearby; rentals leasing fast (median 5d on market — plan ~1-2 weeks tenant-placement turnaround); high-income renter base; 3,982 units permitted in Snohomish County in 2024 (1,492 in 5+ unit buildings).
- Snohomish County population projected at +30% by 2050 — long-run rental-demand tailwind backs the buy-and-hold thesis.
- 2 sale attempts since 23y ago; this cycle's ask has dropped $20k (33%) from the opening price — seller is motivated, your offer sets the floor, not the list.
- Current owner paid $32k; 25% above their basis — modest negotiation headroom, anchor on the comps not their cost.
- At projected returns (-3.0% appreciation + 2.4% rent growth), your $11k cash investment doubles in ~1 year — after that, you're playing with house money.
- Cap rate 69.9% vs local median 1.4% in Bothell East — top-decile yield for the area; either an underpriced asset or a hidden risk that comps aren't pricing in. Stress-test before assuming the spread holds.
Questions for listing agent
- It's been on market 79 days. Have you received any prior offers? Is the seller open to a 6% concession, seller financing, or rate buy-down credit?
- Built in 1976 — when were the roof, HVAC, electrical panel, plumbing, and water heater last replaced?
- Why hasn't it sold? Are there any deal-killer items the seller is aware of (foundation, flood, title, zoning, code violations)?
- Is there a deadline driving the sale (1031 exchange, divorce, estate, relocation)? That informs how much negotiation room exists.
- Schools are A-rated — typically a magnet for longer-tenancy family renters. What's the average tenant stay here, and is there a school-zone premium baked into asking?
- The area grade is low — what's the realistic commute time and amenity access for the typical tenant pool here? Any planned neighborhood developments (good or bad) we should know about?
- What's the average days-on-market for RENTAL listings here right now (not sales)? A rising rental-DOM trend means longer vacancies and softer asking-rent achievability than the comps imply.
- What's the recent tenant-quality profile in this submarket — average credit score on applications, eviction rate, late-payment / NSF rate, and stable-employment percentage? A property-management company in the area should have these aggregated.
CashFlowRE · CFR-0VPVP10Y4F2VEG
· Data 2 days ago
cashflowre.app · 2026-05-29