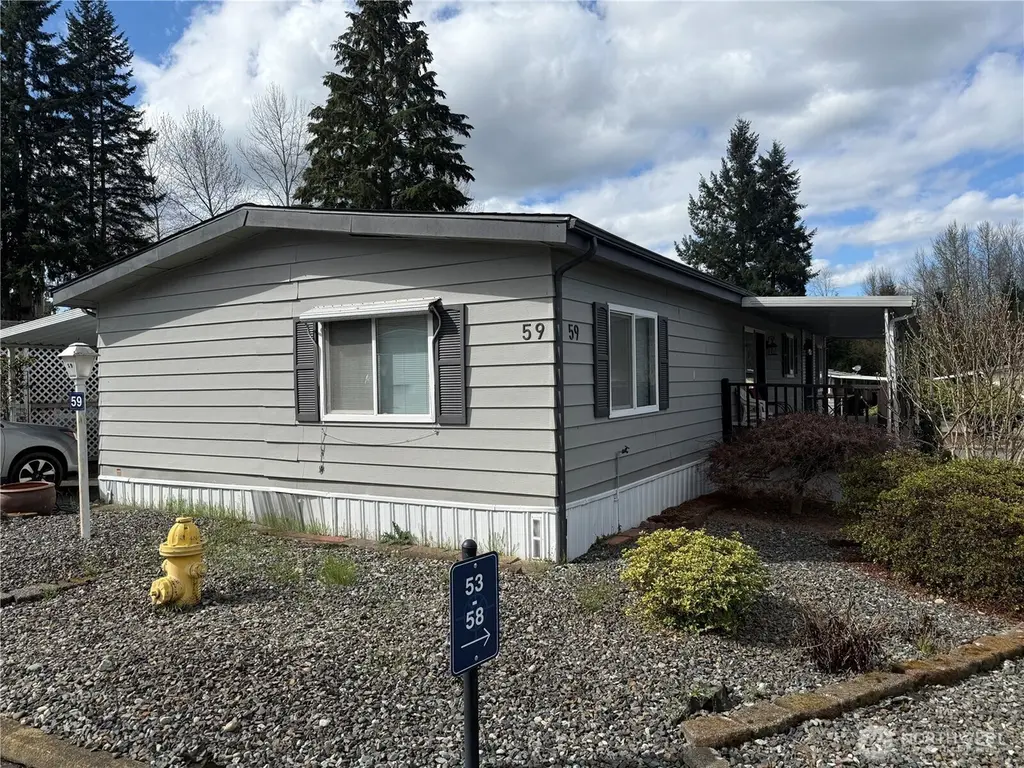
2200 196th St SE Unit #59 · Bothell East, WA
Flood risk No data
- FEMA flood zone
- —
- Chance of flooding over 30 yrs
- —
- Est. flood insurance / yr
- —
Fire risk No data
- Est. fire insurance / yr
- —
Heat risk No data
- Hot days now (above threshold)
- —
- Hot days in 30 yrs
- —
Wind risk No data
- Chance of severe wind over 30 yrs
- —
Air-quality risk No data
- Unhealthy air days now
- —
- Unhealthy air days in 30 yrs
- —
Risk factors via First Street. Map © Google.
Why this score? — see what drove the D+ grade
The composite is a weighted blend of 9 inputs, each scored 0–100. Each bar is that input's sub-score; the figure is the points it added to the 100-point composite (weight × sub-score).
- Cash flow +15.0/30.0
- ARV discount +7.5/15.0
- Schools +6.7/10.0
- 1% rule +5.0/10.0
- DSCR +5.0/10.0
- Livability +4.5/5.0
- Rent growth +3.1/5.0
- Condition / age +2.5/5.0
- Appreciation +0.0/10.0
$39,950
🖨 Deal sheet 📄 Offer letter ✓ Due diligence
Listing remarks
Welcome to Alder Trails, one of Bothell’s most desirable 55+ communities! This charming manufactured home offers an incredible opportunity to create your dream space, with endless potential to update, remodel, and add your personal touch. Whether you envision a modern refresh or a custom renovation, the possibilities here are truly exciting. Nestled in a beautifully maintained, park-like setting, residents enjoy access to community amenities including a clubhouse, fitness center, green space, and regular social events. Ideally located near shopping, dining, and everyday conveniences, with Canyon Park Shopping Center and Canyon Park Place just minutes away. Enjoy nearby outdoor recreat
Key facts
- Green space
- Outdoor recreation
- Fitness center
Tags
Neighborhood map
What this means for you Summary
Snapshot
- This is a 3-bed/2.0-bath manufactured listed at $40k.
Deal economics
- At list price, monthly cash flow is $2k ($25k/yr) — positive.
- The deal already cash-flows at list — no discount required.
- Meets the 1% rule at list price ($3k rent vs $40k).
- Recommended offer: $38k (6.0% below list) — sets the bar for market timing.
- Cap rate 69.9% vs local median 1.4% in Bothell East — top-decile yield for the area; either an underpriced asset or a hidden risk that comps aren't pricing in. Stress-test before assuming the spread holds.
Location & tenants
- Location reads 90/100 on livability (#5 in WA, #104 nationally) — a professional / high-income tenant draw. Strengths: schools A+, crime A+, amenities A+; Watch: cost of living F.
- Northshore School District (suburban): math 69% / reading 78% proficiency, ranked #9 of 291 in WA (top 3%) — strong family-tenant draw, lease renewals of 3-5y typical; only 12% free/reduced lunch — higher-income household profile.
- Market conditions: Rents rising (+2.4%/yr); 451 active listings in the ZIP; 29 comparable units currently listed for rent nearby; rentals leasing fast (median 5d on market — plan ~1-2 weeks tenant-placement turnaround); high-income renter base; 3,982 units permitted in Snohomish County in 2024 (1,492 in 5+ unit buildings).
Forward outlook
- Local home prices are declining (-3.0%/yr); year-one equity from $276 of loan paydown is wiped out by about $1k of value loss. Plan a longer hold.
- Snohomish County population projected at +30% by 2050 — long-run rental-demand tailwind backs the buy-and-hold thesis.
- At projected returns (-3.0% appreciation + 2.4% rent growth), your $11k cash investment doubles in ~1 year — after that, you're playing with house money.
Negotiation context
- It's been on market 79 days — a 6% lower offer ($38k) is reasonable based on typical stale-listing flexibility.
- 2 sale attempts since 23y ago; this cycle's ask has dropped $20k (33%) from the opening price — seller is motivated, your offer sets the floor, not the list.
- Current owner paid $32k; 25% above their basis — modest negotiation headroom, anchor on the comps not their cost.
Questions for the listing agent
- It's been on market 79 days. Have you received any prior offers? Is the seller open to a 6% concession, seller financing, or rate buy-down credit?
- Built in 1976 — when were the roof, HVAC, electrical panel, plumbing, and water heater last replaced?
- Why hasn't it sold? Are there any deal-killer items the seller is aware of (foundation, flood, title, zoning, code violations)?
- Is there a deadline driving the sale (1031 exchange, divorce, estate, relocation)? That informs how much negotiation room exists.
- Schools are A-rated — typically a magnet for longer-tenancy family renters. What's the average tenant stay here, and is there a school-zone premium baked into asking?
- The area grade is low — what's the realistic commute time and amenity access for the typical tenant pool here? Any planned neighborhood developments (good or bad) we should know about?
- What's the average days-on-market for RENTAL listings here right now (not sales)? A rising rental-DOM trend means longer vacancies and softer asking-rent achievability than the comps imply.
- What's the recent tenant-quality profile in this submarket — average credit score on applications, eviction rate, late-payment / NSF rate, and stable-employment percentage? A property-management company in the area should have these aggregated.
- How much new for-sale + rental construction is in the pipeline within 1–3 miles? Heavy new supply typically softens prices + rents 12–24 months out; constrained supply supports both.
Investment metrics
- 1% rule
- 7.48% ✓
- Cap rate
- 69.89%
- Cash-on-cash
- 227.12%
- DSCR
- 11.11
- GRM
- 1.1
CMA / ARV
- ARV (median comp)
- $125,000
- List price
- $39,950
- Delta
- -68.04%
- Verdict
- UNDERPRICED
- Comps
- 11 within 1.0 mi
Show comp detail 11 sales within ~0.75 mi
| Address | Dist | Beds/Ba | Sqft | Sold | Price | $/sf | Match |
|---|---|---|---|---|---|---|---|
| 2200 196th St SE #96 | 0.00mi | 3/2.0 | 1,440 (0%) | 9mo | $80,000 | $56 | 92 |
| 2200 SE 196th St #2 | 0.00mi | 2/2.0 (-1) | 1,440 (0%) | 8mo | $75,000 | $52 | 89 |
| 2200 196th St SE #66 | 0.00mi | 3/2.0 | 1,344 (-7%) | 0mo | $125,000 | $93 | 89 |
| 2200 196th St SE #87 | 0.00mi | 3/2.0 | 1,440 (0%) | 15mo | $100,000 | $69 | 88 |
| 2200 196th St SE #17 | 0.00mi | 2/2.0 (-1) | 1,404 (-2%) | 11mo | $211,400 | $151 | 82 |
| 19315 22nd Ave SE | 0.25mi | 3/2.0 | 1,440 (0%) | 12mo | $365,000 | $253 | 79 |
| 2200 196th St SE #80 | 0.00mi | 2/2.0 (-1) | 1,344 (-7%) | 12mo | $65,600 | $49 | 74 |
| 2000 192nd St SE #116 | 0.32mi | 2/2.0 (-1) | 1,414 (-2%) | 5mo | $429,000 | $303 | 73 |
| 2200 196th St SE #30 | 0.00mi | 2/2.0 (-1) | 1,248 (-13%) | 3mo | $110,000 | $88 | 70 |
| 19229 22nd Ave SE | 0.29mi | 2/2.0 (-1) | 1,344 (-7%) | 17mo | $430,000 | $320 | 56 |
| 1615 208th St SE #40 | 0.60mi | 2/2.0 (-1) | 1,536 (+7%) | 22mo | $212,550 | $138 | 37 |
Match score weights: distance 35% · size 25% · config 20% · recency 20%. Top-matched comps best support the ARV.
Projected returns pro-forma
-3.0% appreciation · 2.37% rent growth · sell at horizon
- IRR
- —
- Equity multiple
- 12.31×
- Total profit
- $126,508
- Equity at exit
- $5,957
- IRR
- —
- Equity multiple
- 25.70×
- Total profit
- $276,264
- Equity at exit
- $3,454
Cash invested: $11,186 (down + closing). Projections, not guarantees.
Landlord ↔ Tenant lean methodology
- Overall (STATE)
- 28 Tenant-Leaning
- State Washington
- 28 Tenant-Leaning · D+8
- County
- — inherits STATE
- City
- — inherits STATE
ZIP-level market 98012
- Rents YoY
- 2.4%
- Active inventory
- 451
- Price-to-rent
- 1.1×
Monthly cashflow live
- Estimated rent
- $2,987 high interval (Pro) →
- Mortgage (P&I)
- −$210
- Tax from tax record
- −$16 /mo · $194/yr
- Insurance
- −$17
- HOA
- −$0
- Vacancy / Maint / Mgmt
- −$627
- Net cashflow
- $2,117
Break-even live
UW: 25.0% down · 7.5% · 30yr · 1.5% tax · 5.0% vac · 8.0% maint · 8.0% mgmt
Financing live
Cash to close
- Down payment
- $9,988
- Closing costs
- $1,198
- Reserves months
- —
- Total cash needed
- —
Loan-product check · same deal, 3 products live
Conventional
25% down · 7.5% · 30yr
- Down + closing
- —
- Monthly P&I
- —
- Monthly cashflow
- —
- DSCR
- —
- Eligible?
- —
Personal DTI + credit; lowest rate.
DSCR
20% down · 8.5% · 30yr
- Down + closing
- —
- Monthly P&I
- —
- Monthly cashflow
- —
- DSCR
- —
- Eligible?
- —
No personal income docs; deal must DSCR.
Hard money
10% down · 12.0% · 12mo
- Down + closing
- —
- Monthly P&I
- —
- Monthly cashflow
- —
- DSCR
- —
- Eligible?
- —
Short-term bridge; refi at stabilization.
Rent comps 29 comps
| Address | Beds | Baths | Sqft | Rent | $/sqft | DOM | Units | Dist |
|---|---|---|---|---|---|---|---|---|
| 2009 196th St SE Bothell, WA | 2.0 | 2.0 | 1017 | $2,355 | $2.32 | 43d | 1 | 0.16mi |
| 2115 201st Pl SE Unit P3 Bothell, WA | 3.0 | 3.0 | 1753 | $2,999 | $1.71 | 5d | 1 | 0.17mi |
| 19905 Bothell Everett Hwy Bothell, WA | 3.0 | 1.0–3.0 | 1244 | $3,560 | $2.86 | 1d | 1 | 0.20mi |
| 19324 22nd Ave SE #4 Bothell, WA | 3.0 | 2.5 | 1195 | $2,950 | $2.47 | 24d | 1 | 0.22mi |
| 2422 Stafford Way Bothell, WA | 4.0 | 2.5 | 1869 | $3,800 | $2.03 | 4d | 1 | 0.28mi |
| 20225 Bothell Everett Hwy Bothell, WA | 1.0–3.0 | 1.0–2.0 | 893 | $2,942 | $3.29 | 2d | 38 | 0.29mi |
| 1730 196th St SE Bothell, WA | 1.0–3.0 | 1.0–2.0 | 924 | $3,215 | $3.48 | 1d | 1 | 0.32mi |
| 19928 Bothell Everett Hwy Bothell, WA | 1.0–2.0 | 1.0–2.0 | 813 | $2,307 | $2.84 | 1d | 12 | 0.35mi |
| 20310 Bothell Everett Hwy Bothell, WA | 2.0–3.0 | 1.5–2.5 | 1195 | $2,880 | $2.41 | 43d | 1 | 0.47mi |
| 2201 192nd St SE Bothell, WA | 3.0 | 2.5 | 1703 | $3,400 | $2.00 | 20d | 1 | 0.51mi |
| 18930 Bothell Everett Hwy Unit V101 Bothell, WA | 2.0 | 2.0 | 980 | $2,225 | $2.27 | 5d | 1 | 0.52mi |
| 1910 189th Pl SE Bothell, WA | 2.0 | 2.0 | 1082 | $2,395 | $2.21 | 20d | 1 | 0.54mi |
| 18930 Bothell Everett Hwy Bothell, WA | 1.0–2.0 | 1.0–2.0 | 933 | $2,225 | $2.38 | 15d | 3 | 0.56mi |
| 18930 Bothell Everett Hwy Bothell, WA | 1.0–2.0 | 1.0–2.0 | 933 | $2,325 | $2.49 | 18d | 3 | 0.56mi |
| 2129 Maltby Rd Bothell, WA | 3.0 | 2.0 | 1207 | $2,195 | $1.82 | 5d | 4 | 0.57mi |
| 1322 194th St SE Bothell, WA | 4.0 | 3.5 | 1800 | $3,550 | $1.97 | 2d | 1 | 0.57mi |
| 20520 Bothell Everett Hwy Bothell, WA | 1.0–2.0 | 1.0–2.0 | 845 | $2,317 | $2.74 | 1d | 9 | 0.58mi |
| 1805 186th Pl SE Bothell, WA | 1.0–3.0 | 1.0–2.0 | 1043 | $2,746 | $2.63 | 1d | 13 | 0.72mi |
| 2319 210th St SE Bothell, WA | 4.0 | 2.5 | 1742 | $3,800 | $2.18 | 24d | 1 | 0.79mi |
| 20707 31st Dr SE Bothell, WA | 2.0 | 2.0 | 1334 | $2,740 | $2.05 | 18d | 1 | 0.86mi |
| 622 204th St SE Bothell, WA | 4.0 | 2.0 | 1800 | $3,400 | $1.89 | 2d | 1 | 1.00mi |
| 1225 183rd St SE Bothell, WA | 1.0–3.0 | 1.0–2.0 | 952 | $3,061 | $3.21 | 1d | 31 | 1.12mi |
| 18331 35th Dr SE Bothell, WA | 3.0 | 2.5 | 1740 | $3,518 | $2.02 | 1d | 1 | 1.17mi |
| 3612 183rd Ln SE Bothell, WA | 3.0 | 2.5 | 1732 | $3,350 | $1.93 | 43d | 1 | 1.21mi |
| 18213 36th Ave SE Bothell, WA | 3.0 | 2.5 | 1740 | $3,400 | $1.95 | 1d | 1 | 1.26mi |
| 21623 16th Dr SE Bothell, WA | 1.0–3.0 | 1.0–2.0 | 990 | $3,295 | $3.33 | 2d | 11 | 1.27mi |
| 17615 Brook Blvd Bothell, WA | 3.0 | 1.5 | 1464 | $3,395 | $2.32 | 3d | 1 | 1.30mi |
| 17606 Brook Blvd Bothell, WA | 3.0 | 2.0 | 1614 | $3,400 | $2.11 | 5d | 1 | 1.30mi |
| 19626 Filbert Rd Bothell, WA | 3.0 | 1.0 | 1084 | $2,800 | $2.58 | 24d | 1 | 1.37mi |
Listing history 18 events
-
2026-06-18days on market $39,950 Active 79 DOM
-
2026-06-17pricedays on market $39,950 Active 78 DOM
-
2026-06-16days on market $49,950 Active 77 DOM
-
2026-06-15days on market $49,950 Active 76 DOM
-
2026-06-13days on market $49,950 Active 74 DOM
-
2026-06-13days on market $49,950 Active 73 DOM
-
2026-06-09days on market $49,950 Active 70 DOM
-
2026-06-08days on market $49,950 Active 69 DOM
-
2026-06-07days on market $49,950 Active 68 DOM
-
2026-06-04days on market $49,950 Active 65 DOM
-
2026-06-03days on market $49,950 Active 64 DOM
-
2026-06-02days on market $49,950 Active 63 DOM
-
2026-06-01days on market $49,950 Active 62 DOM
-
2026-05-31days on market $49,950 Active 61 DOM
-
2026-04-29price $54,950
-
2026-03-31$59,950 Active
-
2004-06-01soldstatus $32,000
-
2003-10-10$34,950
ⓘ Source: listings_history table (triggers on properties + properties_extension) + one-shot
backfill from property_details.listing_events for pre-trigger history.
Tax reassessment forecast WA · Resets to sale price
- Current annual tax
- $194 · $16/mo
- Projected year-2 tax
- $392 · $33/mo
- Expected delta
- +$198/yr (+$16/mo · 102.0%)
ⓘ Screening estimate from a state-policy table — verify with the county assessor before closing.
Nearby sold comps map
Loading sold comps map…
Walkable amenities ~0.75 mi
Loading nearby amenities…
Taxation est. · year 1
- Rental income
- $35,839
- − Mortgage interest
- −$2,238
- − Property taxes
- −$194
- − Insurance
- −$200
- − Repairs & maintenance
- −$2,867
- − Management
- −$2,867
- − Depreciation
- −$1,162
- Taxable income
- $26,311
- Est. tax owed @ 24.0%
- −$6,315
- After-tax cash flow
- $19,091/yr
For passive investors: Depreciation is non-cash, so a rental often shows a tax loss while cash-flowing — sheltering income. Rental losses are passive: they offset passive income freely, and up to $25,000/yr can offset ordinary (W-2) income if you actively participate and your MAGI is under $100k (phasing out to $0 by $150k); unused losses carry forward. On sale, claimed depreciation is recaptured at up to 25%, and gains may owe capital-gains tax (a 1031 exchange can defer both). Figures are a year-1 estimate at your 24.0% rate — not tax advice; consult a CPA.
Schools (NCES district)
- District
- Northshore School District
- NCES district ID
- 5305910
- Math proficiency
- 69% ▼ -3.00%
- Reading proficiency
- 78% ▼ -1.00%
- Median HH income
- $92,951
- Composite
- 67.41/100
- National rank
- #826
- State rank
- #9 of 291 in WA
Livability — Bothell East
- Score
- 90/100
- State rank
- #5
- US rank
- #104
Category grades
Schools grade is shown separately in the Schools card above.
Census & demographics
- Census place
- Bothell East, WA
- County
- Snohomish County · 786,756 people
- Metro
- Seattle-Tacoma-Bellevue, WA
- Population (ZIP)
- 77,041
- Household income
- $146,144
- Rent vs Own
- Severe rent burden
- 1904.0
Population outlook (Snohomish County) Hauer SSP2
- Today (2025)
- 899,800 people
- By 2030
- 960,975 · +6.8%
- By 2040
- 1,074,447 · +19.4%
- By 2050
- 1,171,954 · +30.2%
- By 2075
- 1,384,849 · +53.9%
- By 2100
- 1,497,296 · +66.4%
Race, ethnicity, and origin ACS 2023
- Neighborhood character
- Diverse neighborhood (Simpson 0.65)
- Race & ethnicity
- White 51% Asian 28% Hispanic / Latino 10% Two or more races 9% Black 3%
- Hispanic origin (detail)
- Mexican 6%
- Common ancestry
- Portuguese 4% Italian 3% Slovak 2%
- Foreign-born
- 29% · Canada, China, South Korea
- Languages at home
- 65% English-only · Other Asian/Pacific 8% Other Indo-European 7% Spanish 6%
Political lean MEDSL · Snohomish
- 2024 margin
- D (+19.0) · D 57.8% · R 38.9% · Other 3.3%
- 2008→2024 swing
- +0.1pp no change · 2008: 18.9pp · 2024: 19.0pp
- All cycles
- 2024: D+19.0 2020: D+20.6 2016: D+16.6 2012: D+16.2 2008: D+18.9
Not yet ingested
- Civics
- —
Market trends
- HPI YoY
- ▼ -780.30%
- Current HPI
- 366.3746
- Rent YoY
- ▲ 2.37%
- Metro
- Seattle-Tacoma-Bellevue, WA
- State GDP YoY
- ▲ 4.65%
- F500 in state
- 22
Industry mix (Fortune 500 HQ in WA)
| Industry | F500 HQs | Revenue |
|---|---|---|
| Retail | 2 | $269B |
|
||
| Technology / Retail | 1 | $638B |
|
||
| Technology | 1 | $245B |
|
||
| Telecommunications | 1 | $38B |
|
||
| Food / Beverage | 1 | $36B |
|
||
| Automotive / Trucks | 1 | $34B |
|
||
Price history
+57.2% since first listed4 events — show timeline
- 2026-04-29 Price Changed $54,950 NWMLS as Distributed by MLS Grid
- 2026-03-31 Listed $59,950 NWMLS as Distributed by MLS Grid
- 2004-06-01 Sold (MLS) $32,000 NWMLS as Distributed by MLS Grid
- 2003-10-10 Listed $34,950 NWMLS as Distributed by MLS Grid
Property tax history
-3.5%/yrLatest (2026): $194 · -78.1% YoY. Source: county tax records.
Cash-flow waterfall
monthlySold comps — $/sqft
last 12 mo · ≤1 miLoading sold comps…