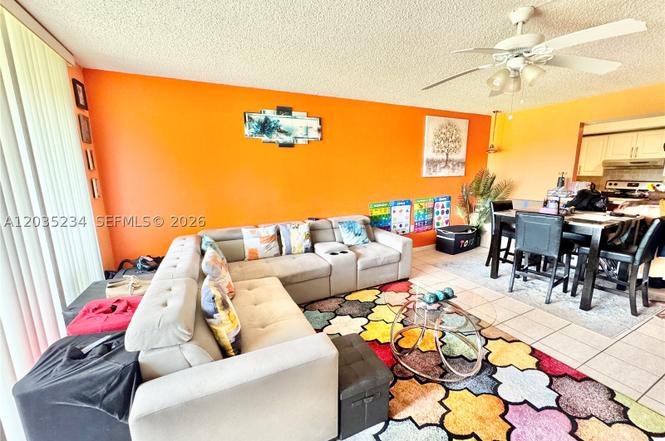
5570 NW 44th St Unit 408A
Lauderhill, FL 33319
$99,900D
1 bd · 2.0 ba ·
833 sqft ·
Built 1980
· Condo
· Active
· 7 DOM
Cashflow @ list (25.0% down · 7.5%)
Estimated rent
$1,718/mo
Mortgage (P&I)
−$524
Tax + insurance
−$240
HOA
−$696
Vac / Maint / Mgmt
−$361
Net cashflow
$-103/mo
Annual
$-1,240/yr
Cap rate
5.05%
Cash-on-cash
-4.43%
DSCR
0.80
1% rule
1.72%
Cash to close
$27,972
Investor read
- This is a 1-bed/2.0-bath condo listed at $100k.
- At list price, monthly cash flow is $-103 ($-1k/yr) — negative.
- To cash-flow at today's rent, offer at most $82k (18.3% below list).
- Meets the 1% rule at list price ($2k rent vs $100k).
- Only 7 days on market — expect competitive offers; lowballing is unlikely to land.
- Recommended offer: $82k (18.3% below list) — sets the bar for cash-flow.
- Local home prices are declining (-3.0%/yr); year-one equity from $691 of loan paydown is wiped out by about $3k of value loss. Plan a longer hold.
- Location reads 79/100 on livability (#139 in FL, #2,059 nationally) — a middle-class / working-renter tenant base. Strengths: commute A+, cost of living A+, housing A+; Watch: schools D, employment D, amenities F.
- Broward (suburban): math 42% / reading 53% proficiency, ranked #46 of 73 in FL (top 63%) — families likely to look elsewhere, expect single-tenant / working-renter base with shorter leases.
- Watch-outs: HOA is 41% of rent.
- Market conditions: Rents soft (-1.4%/yr); 821 active listings in the ZIP; 40 comparable units currently listed for rent nearby; rentals at typical pace (median 19d on market — plan ~3-4 weeks tenant-placement turnaround); 2,111 units permitted in Broward County in 2024 (1,265 in 5+ unit buildings).
- Broward County population projected at +34% by 2050 — long-run rental-demand tailwind backs the buy-and-hold thesis.
- 2 sale attempts; this cycle's ask is 6560% above the opening price — seller raised mid-cycle; expect resistance to lowballs.
- This rent runs 35% of the median local income ($58k/yr) — at the standard rent-burdened threshold; future hikes will face affordability resistance.
Questions for listing agent
- What do current leases actually rent for vs. the listed asking? Can we see a recent rent roll and the last 12 months of T-12 income?
- What does the HOA fee cover, when was the last increase, and are there any pending special assessments or reserve-fund shortfalls?
- Any open or pending special assessments — roof, HVAC, plumbing, elevator, façade? What's the per-unit balance and payoff schedule, and is the seller paying it off at close or rolling it to the buyer?
- Is there a deadline driving the sale (1031 exchange, divorce, estate, relocation)? That informs how much negotiation room exists.
- Schools are D-rated, which usually means shorter tenancies and higher turnover. Who's the typical renter profile here, and what's been the actual vacancy rate?
- The area grade is low — what's the realistic commute time and amenity access for the typical tenant pool here? Any planned neighborhood developments (good or bad) we should know about?
- What's the average days-on-market for RENTAL listings here right now (not sales)? A rising rental-DOM trend means longer vacancies and softer asking-rent achievability than the comps imply.
- What's the recent tenant-quality profile in this submarket — average credit score on applications, eviction rate, late-payment / NSF rate, and stable-employment percentage? A property-management company in the area should have these aggregated.
CashFlowRE · CFR-0VV0680RC2T663
· Data 2 days ago
cashflowre.app · 2026-05-29