5570 NW 44th St Unit 408A · Lauderhill, FL
Flood risk No data
- FEMA flood zone
- —
- Chance of flooding over 30 yrs
- —
- Est. flood insurance / yr
- —
Fire risk No data
- Est. fire insurance / yr
- —
Heat risk No data
- Hot days now (above threshold)
- —
- Hot days in 30 yrs
- —
Wind risk No data
- Chance of severe wind over 30 yrs
- —
Air-quality risk No data
- Unhealthy air days now
- —
- Unhealthy air days in 30 yrs
- —
Risk factors via First Street. Map © Google.
Why this score? — see what drove the D grade
The composite is a weighted blend of 9 inputs, each scored 0–100. Each bar is that input's sub-score; the figure is the points it added to the 100-point composite (weight × sub-score).
- 1% rule +10.0/10.0
- Cash flow +8.0/30.0
- ARV discount +7.5/15.0
- Schools +4.1/10.0
- Livability +4.0/5.0
- Condition / age +2.5/5.0
- Rent growth +2.2/5.0
- DSCR +2.0/10.0
- Appreciation +0.0/10.0
$99,900
🖨 Deal sheet 📄 Offer letter ✓ Due diligence
Listing remarks
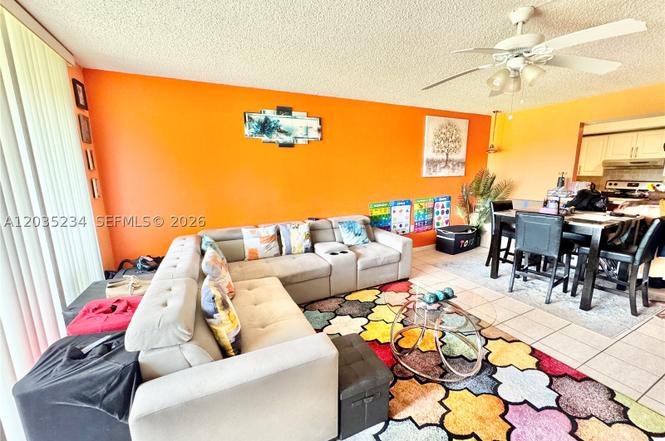
Bright and airy 1BR/1BA condo in an all-ages, gated Inverrary community—a relaxing retreat with convenient access to shopping, dining, and major routes. Features in-unit washer & dryer and a comfortable layout ideal for easy Florida living. Purchase requirements (per Association): minimum $50K gross income ($70K for married couples), 700+ credit score, 20% down payment, and escrow of 3/4 of association fees (or 9 months).
Key facts
- Comfortable layout
- $696 HOA
- Parking
Tags
Property features AI
Finance
- Financial info: Lease considered; No pets allowed
- HOA & community: Monthly association fee; Association amenities include clubhouse, pool, tennis courts, and elevators; Association covers management, common areas, insurance, legal/accounting, ground and structure maintenance, parking, pest control, recreation facilities, reserve fund, roof, sewer, trash and water
Exterior
- Parking: One assigned parking space
- Security: Complex fenced; Intercom; Key card entry
- Home design: Condominium / Attached property; 5-story building; Entry located on level 4; Effective year built
- Construction: Block construction
- Exterior features: No notable exterior features; Association pool
Interior
- Kitchen: Electric range; Dishwasher; Refrigerator
- Flooring: Tile
- Bathrooms: 1 full bathroom; 1 half bathroom
- Heating & cooling: Central heating; Central air conditioning
- Interior features: Tile flooring
- Laundry & utility: Washer; Dryer
Neighborhood map
What this means for you Summary
Snapshot
- This is a 1-bed/2.0-bath condo listed at $100k.
Deal economics
- At list price, monthly cash flow is $-103 ($-1k/yr) — negative.
- To cash-flow at today's rent, offer at most $82k (18.3% below list).
- Meets the 1% rule at list price ($2k rent vs $100k).
- Recommended offer: $82k (18.3% below list) — sets the bar for cash-flow.
Location & tenants
- Location reads 79/100 on livability (#139 in FL, #2,059 nationally) — a middle-class / working-renter tenant base. Strengths: commute A+, cost of living A+, housing A+; Watch: schools D, employment D, amenities F.
- Broward (suburban): math 42% / reading 53% proficiency, ranked #46 of 73 in FL (top 63%) — families likely to look elsewhere, expect single-tenant / working-renter base with shorter leases.
- Market conditions: Rents soft (-1.4%/yr); 821 active listings in the ZIP; 40 comparable units currently listed for rent nearby; rentals at typical pace (median 19d on market — plan ~3-4 weeks tenant-placement turnaround); 2,111 units permitted in Broward County in 2024 (1,265 in 5+ unit buildings).
- This rent runs 35% of the median local income ($58k/yr) — at the standard rent-burdened threshold; future hikes will face affordability resistance.
Forward outlook
- Local home prices are declining (-3.0%/yr); year-one equity from $691 of loan paydown is wiped out by about $3k of value loss. Plan a longer hold.
- Broward County population projected at +34% by 2050 — long-run rental-demand tailwind backs the buy-and-hold thesis.
Negotiation context
- Only 7 days on market — expect competitive offers; lowballing is unlikely to land.
- 2 sale attempts; this cycle's ask is 6560% above the opening price — seller raised mid-cycle; expect resistance to lowballs.
Risks & watch-outs
- Watch-outs: HOA is 41% of rent.
Questions for the listing agent
- What do current leases actually rent for vs. the listed asking? Can we see a recent rent roll and the last 12 months of T-12 income?
- What does the HOA fee cover, when was the last increase, and are there any pending special assessments or reserve-fund shortfalls?
- Any open or pending special assessments — roof, HVAC, plumbing, elevator, façade? What's the per-unit balance and payoff schedule, and is the seller paying it off at close or rolling it to the buyer?
- Is there a deadline driving the sale (1031 exchange, divorce, estate, relocation)? That informs how much negotiation room exists.
- Schools are D-rated, which usually means shorter tenancies and higher turnover. Who's the typical renter profile here, and what's been the actual vacancy rate?
- The area grade is low — what's the realistic commute time and amenity access for the typical tenant pool here? Any planned neighborhood developments (good or bad) we should know about?
- What's the average days-on-market for RENTAL listings here right now (not sales)? A rising rental-DOM trend means longer vacancies and softer asking-rent achievability than the comps imply.
- What's the recent tenant-quality profile in this submarket — average credit score on applications, eviction rate, late-payment / NSF rate, and stable-employment percentage? A property-management company in the area should have these aggregated.
- How much new apartment / multifamily construction is in the pipeline within 1–3 miles? Heavy new supply (>2% of stock underway) typically softens rents 12–24 months out; light construction supports rent growth.
Investment metrics
- 1% rule
- 1.72% ✓
- Cap rate
- 5.05%
- Cash-on-cash
- -4.43%
- DSCR
- 0.80
- GRM
- 4.8
CMA / ARV
No comps found within radius.
Projected returns pro-forma
-3.0% appreciation · 0.0% rent growth · sell at horizon
- IRR
- -31.3%
- Equity multiple
- 0.02×
- Total profit
- $-27,302
- Equity at exit
- $14,895
- IRR
- -95.3%
- Equity multiple
- -0.78×
- Total profit
- $-49,672
- Equity at exit
- $8,638
Cash invested: $27,972 (down + closing). Projections, not guarantees.
Landlord ↔ Tenant lean methodology
- Overall (STATE)
- 87 Strongly Landlord-Friendly
- State Florida
- 87 Strongly Landlord-Friendly · R+3
- County
- — inherits STATE
- City
- — inherits STATE
ZIP-level market 33319
- Rents YoY
- -1.4%
- Active inventory
- 821
- Price-to-rent
- 4.8×
Monthly cashflow live
- Estimated rent
- $1,718 high interval (Pro) →
- Mortgage (P&I)
- −$524
- Tax from tax record
- −$199 /mo · $2,385/yr
- Insurance
- −$42
- HOA
- −$696
- Vacancy / Maint / Mgmt
- −$361
- Net cashflow
- $-103
Break-even live
UW: 25.0% down · 7.5% · 30yr · 1.5% tax · 5.0% vac · 8.0% maint · 8.0% mgmt
Financing live
Cash to close
- Down payment
- $24,975
- Closing costs
- $2,997
- Reserves months
- —
- Total cash needed
- —
Loan-product check · same deal, 3 products live
Conventional
25% down · 7.5% · 30yr
- Down + closing
- —
- Monthly P&I
- —
- Monthly cashflow
- —
- DSCR
- —
- Eligible?
- —
Personal DTI + credit; lowest rate.
DSCR
20% down · 8.5% · 30yr
- Down + closing
- —
- Monthly P&I
- —
- Monthly cashflow
- —
- DSCR
- —
- Eligible?
- —
No personal income docs; deal must DSCR.
Hard money
10% down · 12.0% · 12mo
- Down + closing
- —
- Monthly P&I
- —
- Monthly cashflow
- —
- DSCR
- —
- Eligible?
- —
Short-term bridge; refi at stabilization.
Rent comps 40 comps
| Address | Beds | Baths | Sqft | Rent | $/sqft | DOM | Units | Dist |
|---|---|---|---|---|---|---|---|---|
| 5860 NW 44th St #603 Lauderhill, FL | 2.0 | 2.0 | 1100 | $1,800 | $1.64 | 18d | 1 | 0.06mi |
| 5900 NW 44th St #106 Lauderhill, FL | 2.0 | 2.0 | 1100 | $1,700 | $1.55 | 13d | 1 | 0.12mi |
| 4172 Inverrary Dr #306 Lauderhill, FL | 1.0 | 1.5 | 783 | $1,500 | $1.92 | 10d | 1 | 0.12mi |
| 4176 Inverrary Dr #110 Lauderhill, FL | 2.0 | 2.0 | 972 | $2,000 | $2.06 | 24d | 1 | 0.14mi |
| 4168 Inverrary Dr #408 Lauderhill, FL | 2.0 | 2.0 | 1073 | $1,750 | $1.63 | 24d | 1 | 0.15mi |
| 4166 Inverrary Dr #403 Lauderhill, FL | 2.0 | 2.0 | 972 | $1,750 | $1.80 | 24d | 1 | 0.18mi |
| 4174 Inverrary Dr #907 Lauderhill, FL | 1.0 | 1.0 | 675 | $1,500 | $2.22 | 24d | 1 | 0.18mi |
| 4174 Inverrary Dr #903 Lauderhill, FL | 2.0 | 2.0 | 972 | $1,700 | $1.75 | 20d | 1 | 0.18mi |
| 4174 Inverrary Dr #303 Lauderhill, FL | 2.0 | 2.0 | 972 | $1,675 | $1.72 | 12d | 1 | 0.18mi |
| 4174 Inverrary Dr #811 Lauderhill, FL | 1.0 | 1.5 | 783 | $1,550 | $1.98 | 24d | 1 | 0.18mi |
| 4174 Inverrary Dr #1004 Lauderhill, FL | 2.0 | 2.0 | 972 | $1,750 | $1.80 | 24d | 1 | 0.18mi |
| 4174 Inverrary Dr #401 Lauderhill, FL | 2.0 | 2.0 | 1116 | $2,100 | $1.88 | 24d | 1 | 0.18mi |
| 5530 NW 44th St Lauderhill, FL | 2.0 | 2.0 | 1187 | $2,050 | $1.73 | 24d | 2 | 0.18mi |
| 4156 Inverrary Dr Lauderhill, FL | 2.0 | 2.0 | 993 | $2,200 | $2.22 | 24d | 4 | 0.19mi |
| 4156 Inverrary Dr Lauderhill, FL | 1.0–2.0 | 1.5–2.0 | 899 | $1,625 | $1.81 | 7d | 3 | 0.19mi |
| 4154 Inverrary Dr Lauderhill, FL | 1.0–2.0 | 1.5–2.0 | 877 | $1,250 | $1.42 | 24d | 2 | 0.20mi |
| 4154 Inverrary Dr #206 Lauderhill, FL | 1.0 | 1.5 | 783 | $1,575 | $2.01 | 2d | 1 | 0.20mi |
| 4154 Inverrary Dr #407 Lauderhill, FL | 2.0 | 2.0 | 972 | $1,800 | $1.85 | 10d | 1 | 0.20mi |
| 4158 Inverrary Dr #202 Lauderhill, FL | 2.0 | 2.0 | 1116 | $2,200 | $1.97 | 3d | 1 | 0.21mi |
| 5961 N Falls Circle Dr Lauderhill, FL | 1.0 | 1.5–2.0 | 885 | $1,745 | $1.97 | 3d | 2 | 0.21mi |
| 4152 Inverrary Dr Lauderhill, FL | 2.0 | 2.0 | 1016 | $2,025 | $1.99 | 24d | 2 | 0.22mi |
| 4158 Inverrary Dr Lauderhill, FL | 2.0 | 2.0 | 1044 | $2,100 | $2.01 | 7d | 2 | 0.23mi |
| 4158 Inverrary Dr Lauderhill, FL | 2.0 | 2.0 | 1108 | $2,100 | $1.90 | 17d | 2 | 0.23mi |
| 4164 Inverrary Dr #806 Lauderhill, FL | 1.0 | 1.5 | 783 | $1,600 | $2.04 | 24d | 1 | 0.26mi |
| 4164 Inverrary Dr #102 Lauderhill, FL | 2.0 | 2.0 | 1120 | $2,200 | $1.96 | 14d | 1 | 0.26mi |
| 6010 S Falls Circle Dr #206 Lauderhill, FL | 2.0 | 2.0 | 1093 | $2,350 | $2.15 | 24d | 1 | 0.33mi |
| 6200 NW 44th St #109 Lauderhill, FL | 2.0 | 2.0 | 1092 | $1,850 | $1.69 | 10d | 1 | 0.34mi |
| 6100 NW 44th St #302 Lauderhill, FL | 2.0 | 2.0 | 1092 | $1,800 | $1.65 | 24d | 1 | 0.38mi |
| 3740 Inverrary Dr Lauderhill, FL | 1.0 | 1.5 | 800 | $1,500 | $1.87 | 18d | 3 | 0.40mi |
| 3750 Inverrary Dr Lauderhill, FL | 1.0–2.0 | 1.5–2.0 | 975 | $1,450 | $1.49 | 24d | 3 | 0.41mi |
| 3760 Inverrary Dr Lauderhill, FL | 2.0 | 1.0–2.0 | 800 | $1,725 | $2.16 | 5d | 3 | 0.42mi |
| 3730 Inverrary Dr Unit 1D Lauderhill, FL | 1.0 | 1.5 | 800 | $1,600 | $2.00 | 24d | 1 | 0.42mi |
| 3650 Inverrary Dr Lauderhill, FL | 1.0 | 1.5 | 800 | $1,535 | $1.92 | 20d | 2 | 0.47mi |
| 3650 Inverrary Dr Lauderhill, FL | 1.0 | 1.0–1.5 | 610 | $1,570 | $2.57 | 13d | 3 | 0.47mi |
| 3650 Inverrary Dr Lauderhill, FL | 1.0 | 1.0–1.5 | 610 | $1,570 | $2.57 | 2d | 3 | 0.47mi |
| 6361 N Falls Circle Dr #106 Lauderhill, FL | 1.0 | 2.0 | 870 | $1,540 | $1.77 | 7d | 1 | 0.48mi |
| 6361 N Falls Circle Dr #106 Lauderhill, FL | 1.0 | 2.0 | 870 | $1,550 | $1.78 | 24d | 1 | 0.48mi |
| 3720 Inverrary Dr Lauderhill, FL | 3.0 | 1.0–2.0 | 940 | $1,600 | $1.70 | 10d | 5 | 0.49mi |
| 3710 Inverrary Dr Lauderhill, FL | 1.0 | 1.5 | 900 | $1,674 | $1.86 | 14d | 2 | 0.50mi |
| 3710 Inverrary Dr Unit 2S Lauderhill, FL | 1.0 | 1.5 | 1000 | $2,099 | $2.10 | 4d | 1 | 0.50mi |
HOA detail condo
- Monthly dues
- $696 · $8,352/yr
- Likely covers
- security
- Assessments
- None detected in remarks — confirm with the listing agent.
Listing history 6 events
-
2026-06-18days on market $99,900 Active 7 DOM
-
2026-06-17days on market $99,900 Active 6 DOM
-
2026-06-16days on market $99,900 Active 5 DOM
-
2026-06-15days on market $99,900 Active 4 DOM
-
2026-06-13remarks 427-char remark
-
2026-06-13$99,900 Active 2 DOM
ⓘ Source: listings_history table (triggers on properties + properties_extension) + one-shot
backfill from property_details.listing_events for pre-trigger history.
Tax reassessment forecast FL · Resets to sale price
- Current annual tax
- $2,385 · $199/mo
- Projected year-2 tax
- $2,385 · $199/mo
- Expected delta
- $0/yr ($0/mo · 0.0%)
ⓘ Screening estimate from a state-policy table — verify with the county assessor before closing.
Nearby sold comps map
Loading sold comps map…
Walkable amenities ~0.75 mi
Loading nearby amenities…
Taxation est. · year 1
- Rental income
- $20,612
- − Mortgage interest
- −$5,596
- − Property taxes
- −$2,385
- − Insurance
- −$500
- − Repairs & maintenance
- −$1,649
- − Management
- −$1,649
- − HOA
- −$8,352
- − Depreciation
- −$2,906
- Taxable loss
- −$2,424
- Est. tax savings @ 24.0%
- +$582
- After-tax cash flow
- $-658/yr
For passive investors: Depreciation is non-cash, so a rental often shows a tax loss while cash-flowing — sheltering income. Rental losses are passive: they offset passive income freely, and up to $25,000/yr can offset ordinary (W-2) income if you actively participate and your MAGI is under $100k (phasing out to $0 by $150k); unused losses carry forward. On sale, claimed depreciation is recaptured at up to 25%, and gains may owe capital-gains tax (a 1031 exchange can defer both). Figures are a year-1 estimate at your 24.0% rate — not tax advice; consult a CPA.
Schools (NCES district)
- District
- Broward
- NCES district ID
- 1200180
- Math proficiency
- 42% ▼ -18.00%
- Reading proficiency
- 53% ▼ -5.00%
- Median HH income
- $52,139
- Composite
- 40.88/100
- National rank
- #3621
- State rank
- #46 of 73 in FL
Livability — Lauderhill
- Score
- 79/100
- State rank
- #139
- US rank
- #2059
Category grades
Schools grade is shown separately in the Schools card above.
Census & demographics
- Census place
- Lauderhill, FL
- County
- Broward County · 1,963,430 people
- City population
- 62,807
- Metro
- Miami-Fort Lauderdale-Pompano Beach, FL
- Population (ZIP)
- 54,450
- Household income
- $58,388
- Rent vs Own
- Severe rent burden
- 2809.0
Population outlook (Broward County) Hauer SSP2
- Today (2025)
- 2,207,033 people
- By 2030
- 2,360,704 · +7.0%
- By 2040
- 2,661,208 · +20.6%
- By 2050
- 2,946,698 · +33.5%
- By 2075
- 3,602,273 · +63.2%
- By 2100
- 3,970,984 · +79.9%
Race, ethnicity, and origin ACS 2023
- Neighborhood character
- Diverse neighborhood (Simpson 0.58)
- Race & ethnicity
- Black 61% Hispanic / Latino 17% White 15% Two or more races 11% Asian 4%
- Hispanic origin (detail)
- Puerto Rican 4% Cuban 2% Dominican 1%
- Common ancestry
- Hispanic 13% Romanian 1% Italian 1%
- Foreign-born
- 46% · Canada, Jamaica, Vietnam
- Languages at home
- 64% English-only · Spanish 15% French/Haitian/Cajun 15% Other Indo-European 2%
Political lean MEDSL · Broward
- 2024 margin
- D (+17.0) · D 58.0% · R 41.0%
- 2008→2024 swing
- -17.8pp toward R · 2008: 34.7pp · 2024: 17.0pp
- All cycles
- 2024: D+17.0 2020: D+29.8 2016: D+35.0 2012: D+34.9 2008: D+34.7
Not yet ingested
- Civics
- —
Market trends
- HPI YoY
- ▼ -202.84%
- Current HPI
- 328.4307
- Rent YoY
- ▼ -1.38%
- Metro
- Miami-Fort Lauderdale-Pompano Beach, FL
- State GDP YoY
- ▲ 3.28%
- F500 in state
- 36
Industry mix (Fortune 500 HQ in FL)
| Industry | F500 HQs | Revenue |
|---|---|---|
| Industrial Technology | 2 | $29B |
|
||
| Insurance | 2 | $17B |
|
||
| Retail | 1 | $60B |
|
||
| Technology Distribution | 1 | $58B |
|
||
| Homebuilding | 1 | $35B |
|
||
| Technology Manufacturing | 1 | $35B |
|
||
Price history
-95.0% since first listed5 events — show timeline
- 2026-06-12 Listed for Rent $1,500 RMLSFL
- 2026-06-11 Listed $99,900 MARMLS
- 2005-07-29 Sold (Public Records) $101,000 Public Records
- 2003-05-16 Sold (Public Records) $59,400 Public Records
- 2001-07-24 Sold (Public Records) $30,000 Public Records
Property tax history
+5.8%/yrLatest (2025): $2,385 · +2.3% YoY. Source: county tax records.
Cash-flow waterfall
monthlySold comps — $/sqft
last 12 mo · ≤1 miLoading sold comps…