7573 Wedgewood Way
Maple Grove, MN 55311
$209,900C-
2 bd · 1.5 ba ·
1,100 sqft ·
Built 1986
· Townhouse
· Pending
· 101 DOM
Cashflow @ list (25.0% down · 7.5%)
Estimated rent
$2,079/mo
Mortgage (P&I)
−$1,101
Tax + insurance
−$277
HOA
−$318
Vac / Maint / Mgmt
−$437
Net cashflow
$-53/mo
Annual
$-639/yr
Cap rate
5.99%
Cash-on-cash
-1.09%
DSCR
0.95
1% rule
0.99%
Cash to close
$58,772
Investor read
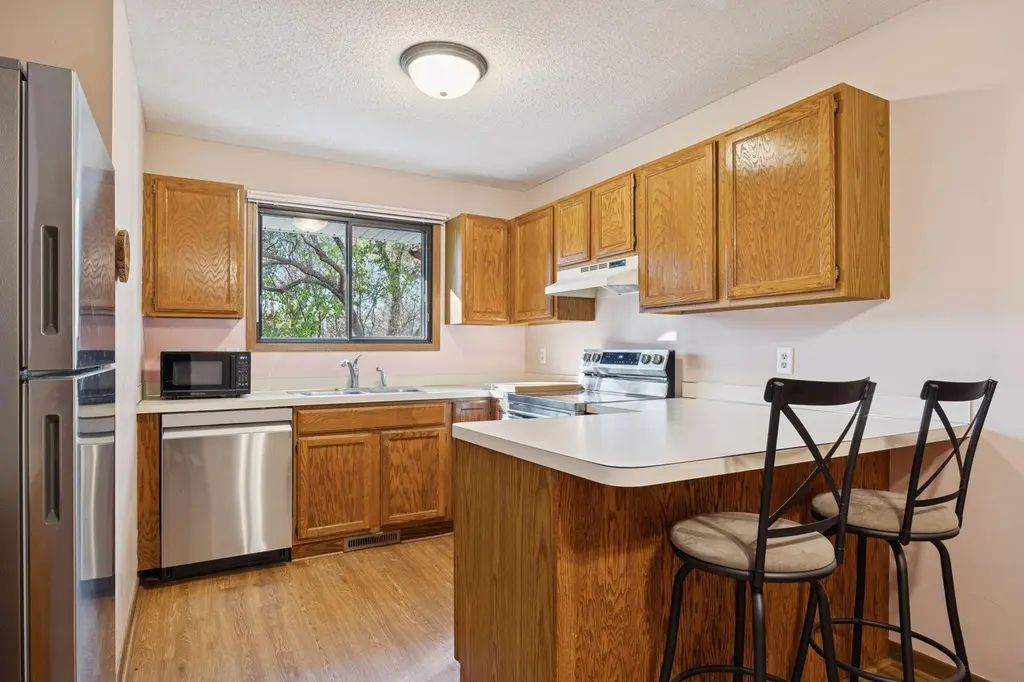
- This is a 2-bed/1.5-bath townhouse listed at $210k.
- At list price, monthly cash flow is $-53 ($-639/yr) — negative.
- To cash-flow at today's rent, offer at most $200k (4.5% below list).
- To meet the 1% rule (rent ≥ 1% of price), the offer needs to be $208k (0.9% below list).
- It's been on market 101 days — a 9% lower offer ($191k) is reasonable based on typical stale-listing flexibility.
- Recommended offer: $191k (9.0% below list) — sets the bar for market timing.
- Local home prices are declining (-3.0%/yr); year-one equity from $1k of loan paydown is wiped out by about $6k of value loss. Plan a longer hold.
- Location reads 81/100 on livability (#54 in MN, #1,353 nationally) — a professional / high-income tenant draw. Strengths: commute A+, employment A+, housing A+; Watch: amenities D, cost of living D.
- Osseo Public School District (suburban): math 42% / reading 51% proficiency, ranked #129 of 301 in MN (top 43%) — families likely to look elsewhere, expect single-tenant / working-renter base with shorter leases.
- Market conditions: Rents rising fast (+5.9%/yr); 300 active listings in the ZIP; 5 comparable units currently listed for rent nearby; rentals at typical pace (median 22d on market — plan ~3-4 weeks tenant-placement turnaround); 40% of comp listings sitting > 30 days — soft ceiling on asking rent; high-income renter base; 4,651 units permitted in Hennepin County in 2024 (2,443 in 5+ unit buildings).
- Hennepin County population projected at +30% by 2050 — long-run rental-demand tailwind backs the buy-and-hold thesis.
- 6 sale attempts since 32y ago with the ask held roughly flat each time — persistent listings suggest the price (not the market) is what's stuck; bring a comps-based counter.
- Cap rate 6.0% vs local median 3.4% in Maple Grove — top-decile yield for the area; either an underpriced asset or a hidden risk that comps aren't pricing in. Stress-test before assuming the spread holds.
- This rent is only 16% of the median local income ($154k/yr) — well below the 30% rent-burden line; pricing power to push rent on renewal without tenant pushback.
Questions for listing agent
- What do current leases actually rent for vs. the listed asking? Can we see a recent rent roll and the last 12 months of T-12 income?
- It's been on market 101 days. Have you received any prior offers? Is the seller open to a 9% concession, seller financing, or rate buy-down credit?
- What does the HOA fee cover, when was the last increase, and are there any pending special assessments or reserve-fund shortfalls?
- Why hasn't it sold? Are there any deal-killer items the seller is aware of (foundation, flood, title, zoning, code violations)?
- Is there a deadline driving the sale (1031 exchange, divorce, estate, relocation)? That informs how much negotiation room exists.
- Schools are A-rated — typically a magnet for longer-tenancy family renters. What's the average tenant stay here, and is there a school-zone premium baked into asking?
- What's the average days-on-market for RENTAL listings here right now (not sales)? A rising rental-DOM trend means longer vacancies and softer asking-rent achievability than the comps imply.
- What's the recent tenant-quality profile in this submarket — average credit score on applications, eviction rate, late-payment / NSF rate, and stable-employment percentage? A property-management company in the area should have these aggregated.
CashFlowRE · CFR-0W7XAXFGPZJEP7
· Data 1 week ago
cashflowre.app · 2026-05-29