7573 Wedgewood Way · Maple Grove, MN
Flood risk 1/10 · Minimal
- FEMA flood zone
- X (unshaded)
- Chance of flooding over 30 yrs
- 0.0%
- Est. flood insurance / yr
- $507 – $1,088
Fire risk 1/10 · Minimal
- Est. fire insurance / yr
- $888 – $1,650
Heat risk 2/10 · Minimal
- Hot days now (above 99°F)
- 7 days/yr
- Hot days in 30 yrs
- 14 days/yr
Wind risk 2/10 · Minimal
- Chance of severe wind over 30 yrs
- —
Air-quality risk 2/10 · Minimal
- Unhealthy air days now
- 1 days/yr
- Unhealthy air days in 30 yrs
- 1 days/yr
Risk factors via First Street. Map © Google.
Why this score? — see what drove the C- grade
The composite is a weighted blend of 9 inputs, each scored 0–100. Each bar is that input's sub-score; the figure is the points it added to the 100-point composite (weight × sub-score).
- ARV discount +15.0/15.0
- Cash flow +11.9/30.0
- 1% rule +4.9/10.0
- Schools +4.2/10.0
- Rent growth +4.0/5.0
- Livability +4.0/5.0
- DSCR +3.5/10.0
- Condition / age +2.5/5.0
- Appreciation +0.0/10.0
$209,900
🖨 Deal sheet 📄 Offer letter ✓ Due diligence
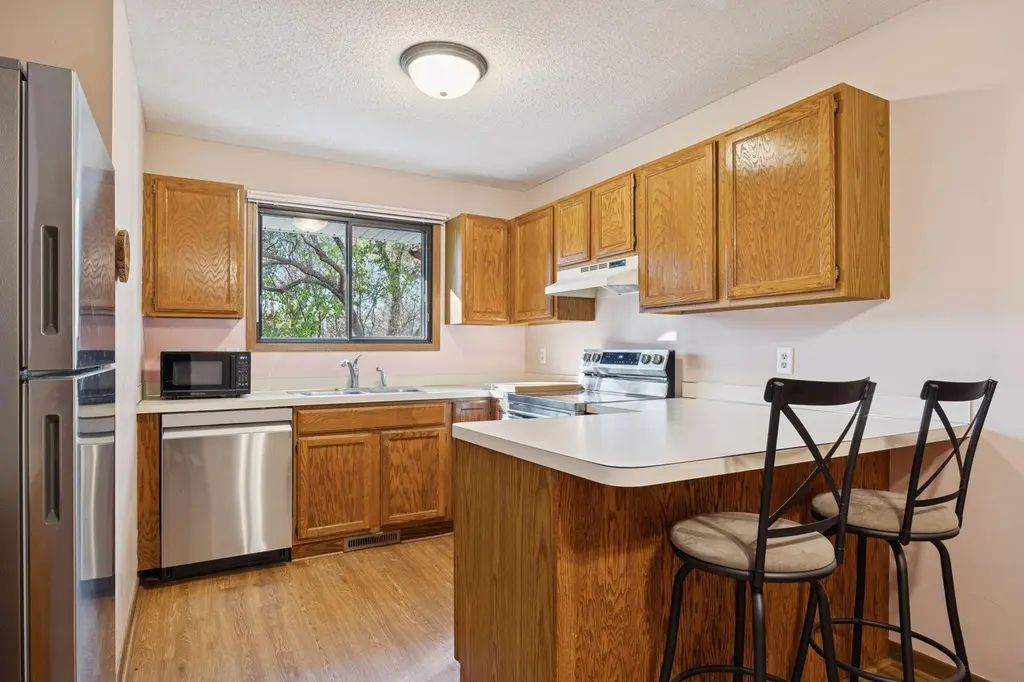
Listing remarks
Charming 2 bedroom unit with great privacy and green space with trails to enjoy right outside. Good size bedrooms with a nice walk in closet for master. New appliances in kitchen and new flooring on the upper and lower level make this an easy move right in. Excellent location with great freeway access, shopping and restaurants close by. Nice attached garage with no steps to inside of home. Beautiful big living room window for natural light and green space outside!
Key facts
- $318 HOA
- Garage
- Built 1986
Neighborhood map
What this means for you Summary
Snapshot
- This is a 2-bed/1.5-bath townhouse listed at $210k.
Deal economics
- At list price, monthly cash flow is $-53 ($-639/yr) — negative.
- To cash-flow at today's rent, offer at most $200k (4.5% below list).
- To meet the 1% rule (rent ≥ 1% of price), the offer needs to be $208k (0.9% below list).
- Recommended offer: $191k (9.0% below list) — sets the bar for market timing.
- Cap rate 6.0% vs local median 3.4% in Maple Grove — top-decile yield for the area; either an underpriced asset or a hidden risk that comps aren't pricing in. Stress-test before assuming the spread holds.
Location & tenants
- Location reads 81/100 on livability (#54 in MN, #1,353 nationally) — a professional / high-income tenant draw. Strengths: commute A+, employment A+, housing A+; Watch: amenities D, cost of living D.
- Osseo Public School District (suburban): math 42% / reading 51% proficiency, ranked #129 of 301 in MN (top 43%) — families likely to look elsewhere, expect single-tenant / working-renter base with shorter leases.
- Market conditions: Rents rising fast (+5.9%/yr); 300 active listings in the ZIP; 5 comparable units currently listed for rent nearby; rentals at typical pace (median 22d on market — plan ~3-4 weeks tenant-placement turnaround); 40% of comp listings sitting > 30 days — soft ceiling on asking rent; high-income renter base; 4,651 units permitted in Hennepin County in 2024 (2,443 in 5+ unit buildings).
- This rent is only 16% of the median local income ($154k/yr) — well below the 30% rent-burden line; pricing power to push rent on renewal without tenant pushback.
Forward outlook
- Local home prices are declining (-3.0%/yr); year-one equity from $1k of loan paydown is wiped out by about $6k of value loss. Plan a longer hold.
- Hennepin County population projected at +30% by 2050 — long-run rental-demand tailwind backs the buy-and-hold thesis.
Negotiation context
- It's been on market 101 days — a 9% lower offer ($191k) is reasonable based on typical stale-listing flexibility.
- 6 sale attempts since 32y ago with the ask held roughly flat each time — persistent listings suggest the price (not the market) is what's stuck; bring a comps-based counter.
Questions for the listing agent
- What do current leases actually rent for vs. the listed asking? Can we see a recent rent roll and the last 12 months of T-12 income?
- It's been on market 101 days. Have you received any prior offers? Is the seller open to a 9% concession, seller financing, or rate buy-down credit?
- What does the HOA fee cover, when was the last increase, and are there any pending special assessments or reserve-fund shortfalls?
- Why hasn't it sold? Are there any deal-killer items the seller is aware of (foundation, flood, title, zoning, code violations)?
- Is there a deadline driving the sale (1031 exchange, divorce, estate, relocation)? That informs how much negotiation room exists.
- Schools are A-rated — typically a magnet for longer-tenancy family renters. What's the average tenant stay here, and is there a school-zone premium baked into asking?
- What's the average days-on-market for RENTAL listings here right now (not sales)? A rising rental-DOM trend means longer vacancies and softer asking-rent achievability than the comps imply.
- What's the recent tenant-quality profile in this submarket — average credit score on applications, eviction rate, late-payment / NSF rate, and stable-employment percentage? A property-management company in the area should have these aggregated.
- How much new for-sale + rental construction is in the pipeline within 1–3 miles? Heavy new supply typically softens prices + rents 12–24 months out; constrained supply supports both.
Investment metrics
- 1% rule
- 0.99% ✗
- Cap rate
- 5.99%
- Cash-on-cash
- -1.09%
- DSCR
- 0.95
- GRM
- 8.4
CMA / ARV
- ARV (median comp)
- $299,813
- List price
- $209,900
- Delta
- -29.99%
- Verdict
- UNDERPRICED
- Comps
- 1 within 2.0 mi
Projected returns pro-forma
-3.0% appreciation · 5.86% rent growth · sell at horizon
- IRR
- -14.3%
- Equity multiple
- 0.47×
- Total profit
- $-31,069
- Equity at exit
- $31,297
- IRR
- -0.8%
- Equity multiple
- 0.93×
- Total profit
- $-3,902
- Equity at exit
- $18,148
Cash invested: $58,772 (down + closing). Projections, not guarantees.
Landlord ↔ Tenant lean methodology
- Overall (STATE)
- 46 Balanced
- State Minnesota
- 46 Balanced · D+2
- County
- — inherits STATE
- City
- — inherits STATE
ZIP-level market 55311
- Rents YoY
- 5.9%
- Active inventory
- 300
- Price-to-rent
- 8.4×
Monthly cashflow live
- Estimated rent
- $2,079 high interval (Pro) →
- Mortgage (P&I)
- −$1,101
- Tax from tax record
- −$190 /mo · $2,274/yr
- Insurance
- −$87
- HOA
- −$318
- Vacancy / Maint / Mgmt
- −$437
- Net cashflow
- $-53
Break-even live
UW: 25.0% down · 7.5% · 30yr · 1.5% tax · 5.0% vac · 8.0% maint · 8.0% mgmt
Financing live
Cash to close
- Down payment
- $52,475
- Closing costs
- $6,297
- Reserves months
- —
- Total cash needed
- —
Loan-product check · same deal, 3 products live
Conventional
25% down · 7.5% · 30yr
- Down + closing
- —
- Monthly P&I
- —
- Monthly cashflow
- —
- DSCR
- —
- Eligible?
- —
Personal DTI + credit; lowest rate.
DSCR
20% down · 8.5% · 30yr
- Down + closing
- —
- Monthly P&I
- —
- Monthly cashflow
- —
- DSCR
- —
- Eligible?
- —
No personal income docs; deal must DSCR.
Hard money
10% down · 12.0% · 12mo
- Down + closing
- —
- Monthly P&I
- —
- Monthly cashflow
- —
- DSCR
- —
- Eligible?
- —
Short-term bridge; refi at stabilization.
Rent comps 5 comps
| Address | Beds | Baths | Sqft | Rent | $/sqft | DOM | Units | Dist |
|---|---|---|---|---|---|---|---|---|
| 14027 81st Ave N Maple Grove, MN | 2.0 | 1.0 | 1000 | $1,500 | $1.50 | 43d | 1 | 0.70mi |
| 8108 Oakview Cir N Maple Grove, MN | 2.0 | 2.0 | 1489 | $2,195 | $1.47 | 21d | 1 | 0.96mi |
| 13301 Maple Knoll Way Maple Grove, MN | 1.0–3.0 | 1.0–2.0 | 1040 | $2,190 | $2.11 | 1d | 13 | 0.98mi |
| 11851 81st Ave N Maple Grove, MN | 1.0–3.0 | 1.0–2.0 | 1213 | $2,102 | $1.73 | 1d | 37 | 1.08mi |
| 14169 68th Pl N Unit 1 Maple Grove, MN | 3.0 | 1.0 | 1000 | $1,995 | $2.00 | 43d | 1 | 1.08mi |
HOA detail
- Monthly dues
- $318 · $3,816/yr
Listing history 27 events
-
2026-06-07statusdays on market $209,900 Pending 101 DOM
-
2026-06-04days on market $209,900 Contingent - Subject to Statutory Rescission 100 DOM
-
2026-06-03days on market $209,900 Contingent - Subject to Statutory Rescission 99 DOM
-
2026-06-02days on market $209,900 Contingent - Subject to Statutory Rescission 98 DOM
-
2026-06-01days on market $209,900 Contingent - Subject to Statutory Rescission 97 DOM
-
2026-05-31days on market $209,900 Contingent - Subject to Statutory Rescission 96 DOM
-
2026-05-20historical
-
2026-05-18status Active
-
2026-05-14historical Contingent - Subject to Statutory Rescission
-
2026-05-06price $209,900
-
2026-02-24$215,000 Active
-
2026-02-24historical
-
2025-11-21$220,000 Active
-
2025-11-20historical
-
2024-07-23soldstatus $211,000
-
2024-07-09soldstatus $211,000 Sold
-
2024-06-08status Pending
-
2024-05-31historical Contingent - Inspection
-
2024-05-28status Active
-
2024-05-24historical Contingent - Inspection
-
2024-05-19$211,000 Active
-
1999-12-10soldstatus $90,000
-
1994-10-17soldstatus $66,500
-
1994-10-13soldstatus $66,500
-
1994-09-30soldstatus $66,500
-
1994-08-22historical
-
1994-08-10$67,900
ⓘ Source: listings_history table (triggers on properties + properties_extension) + one-shot
backfill from property_details.listing_events for pre-trigger history.
Tax reassessment forecast MN · Partial reset (capped growth)
- Current annual tax
- $2,274 · $190/mo
- Projected year-2 tax
- $2,313 · $193/mo
- Expected delta
- +$38/yr (+$3/mo · 1.7%)
ⓘ Screening estimate from a state-policy table — verify with the county assessor before closing.
Climate risk First Street
- Flood 1/10 Low FEMA zone X (unshaded) · 0% chance over 30 yrs
- Wildfire 1/10 Low
- Heat 2/10 Low 7 d/yr ≥99°F today · 14 d/yr by 30 yrs out
- Wind 2/10 Low
- Air quality 2/10 Low 1 unhealthy d/yr today · 1 by 30 yrs out
Nearby sold comps map
Loading sold comps map…
Walkable amenities ~0.75 mi
Loading nearby amenities…
Taxation est. · year 1
- Rental income
- $24,949
- − Mortgage interest
- −$11,758
- − Property taxes
- −$2,274
- − Insurance
- −$1,050
- − Repairs & maintenance
- −$1,996
- − Management
- −$1,996
- − HOA
- −$3,816
- − Depreciation
- −$6,106
- Taxable loss
- −$4,047
- Est. tax savings @ 24.0%
- +$971
- After-tax cash flow
- $332/yr
For passive investors: Depreciation is non-cash, so a rental often shows a tax loss while cash-flowing — sheltering income. Rental losses are passive: they offset passive income freely, and up to $25,000/yr can offset ordinary (W-2) income if you actively participate and your MAGI is under $100k (phasing out to $0 by $150k); unused losses carry forward. On sale, claimed depreciation is recaptured at up to 25%, and gains may owe capital-gains tax (a 1031 exchange can defer both). Figures are a year-1 estimate at your 24.0% rate — not tax advice; consult a CPA.
Schools (NCES district)
- District
- Osseo Public School District
- NCES district ID
- 2725200
- Math proficiency
- 42% ▼ -7.00%
- Reading proficiency
- 51% ▼ -4.00%
- Median HH income
- $76,168
- Composite
- 42.35/100
- National rank
- #3250
- State rank
- #129 of 301 in MN
Livability — Maple Grove
- Score
- 81/100
- State rank
- #54
- US rank
- #1353
Category grades
Schools grade is shown separately in the Schools card above.
Census & demographics
- Census place
- Maple Grove, MN
- County
- Hennepin County · 1,150,272 people
- City population
- 77,762
- Metro
- Minneapolis-St. Paul-Bloomington, MN-WI
- Population (ZIP)
- 38,472
- Household income
- $153,568
- Rent vs Own
- Severe rent burden
- 497.0
Population outlook (Hennepin County) Hauer SSP2
- Today (2025)
- 1,405,227 people
- By 2030
- 1,492,650 · +6.2%
- By 2040
- 1,660,157 · +18.1%
- By 2050
- 1,823,498 · +29.8%
- By 2075
- 2,221,283 · +58.1%
- By 2100
- 2,509,976 · +78.6%
Race, ethnicity, and origin ACS 2023
- Neighborhood character
- Predominantly White (80%)
- Race & ethnicity
- White 80% Asian 8% Black 7% Two or more races 3% Hispanic / Latino 1%
- Common ancestry
- Portuguese 12% Lithuanian 4% Romanian 4%
- Foreign-born
- 12% · Canada, Vietnam, South Korea
- Languages at home
- 87% English-only · Other Indo-European 3% Vietnamese 1% Chinese 1%
Political lean MEDSL · Hennepin
- 2024 margin
- Solid D (+42.6) · D 70.2% · R 27.5% · Other 2.3%
- 2008→2024 swing
- +14.0pp toward D · 2008: 28.6pp · 2024: 42.6pp
- All cycles
- 2024: D+42.6 2020: D+43.2 2016: D+35.3 2012: D+27.1 2008: D+28.6
Not yet ingested
- Civics
- —
Market trends
- HPI YoY
- ▼ -181.69%
- Current HPI
- 213.3896
- Rent YoY
- ▲ 5.86%
- Metro
- Minneapolis-St. Paul-Bloomington, MN-WI
- State GDP YoY
- ▲ 2.41%
- F500 in state
- 34
Industry mix (Fortune 500 HQ in MN)
| Industry | F500 HQs | Revenue |
|---|---|---|
| Healthcare | 2 | $407B |
|
||
| Retail | 2 | $150B |
|
||
| Consumer Goods | 2 | $32B |
|
||
| Industrial Machinery | 2 | $6B |
|
||
| Agriculture | 1 | $40B |
|
||
| Healthcare / Medical Devices | 1 | $32B |
|
||
Price history
+209.1% since first listed21 events — show timeline
- 2026-05-20 Listing Removed — NORTHSTARMLS as Distributed by MLS Grid
- 2026-05-18 Relisted — NORTHSTARMLS as Distributed by MLS Grid
- 2026-05-14 Contingent — NORTHSTARMLS as Distributed by MLS Grid
- 2026-05-06 Price Changed $209,900 NORTHSTARMLS as Distributed by MLS Grid
- 2026-02-24 Listing Removed — NORTHSTARMLS as Distributed by MLS Grid
- 2026-02-24 Listed $215,000 NORTHSTARMLS as Distributed by MLS Grid
- 2025-11-21 Listed $220,000 NORTHSTARMLS as Distributed by MLS Grid
- 2025-11-20 Coming Soon — NORTHSTARMLS as Distributed by MLS Grid
- 2024-07-23 Sold (Public Records) $211,000 Public Records
- 2024-07-09 Sold (MLS) $211,000 NORTHSTARMLS as Distributed by MLS Grid
- 2024-06-08 Pending — NORTHSTARMLS as Distributed by MLS Grid
- 2024-05-31 Contingent — NORTHSTARMLS as Distributed by MLS Grid
- 2024-05-28 Relisted — NORTHSTARMLS as Distributed by MLS Grid
- 2024-05-24 Contingent — NORTHSTARMLS as Distributed by MLS Grid
- 2024-05-19 Listed $211,000 NORTHSTARMLS as Distributed by MLS Grid
- 1999-12-10 Sold (Public Records) $90,000 Public Records
- 1994-10-17 Sold (Public Records) $66,500 Public Records
- 1994-10-13 Sold (Public Records) $66,500 Public Records
- 1994-09-30 Sold (MLS) $66,500 NORTHSTARMLS as Distributed by MLS Grid
- 1994-08-22 Listing Removed — NORTHSTARMLS as Distributed by MLS Grid
- 1994-08-10 Listed $67,900 NORTHSTARMLS as Distributed by MLS Grid
Property tax history
+5.2%/yrLatest (2025): $2,274 · +7.5% YoY. Source: county tax records.
Cash-flow waterfall
monthlySold comps — $/sqft
last 12 mo · ≤1 miLoading sold comps…