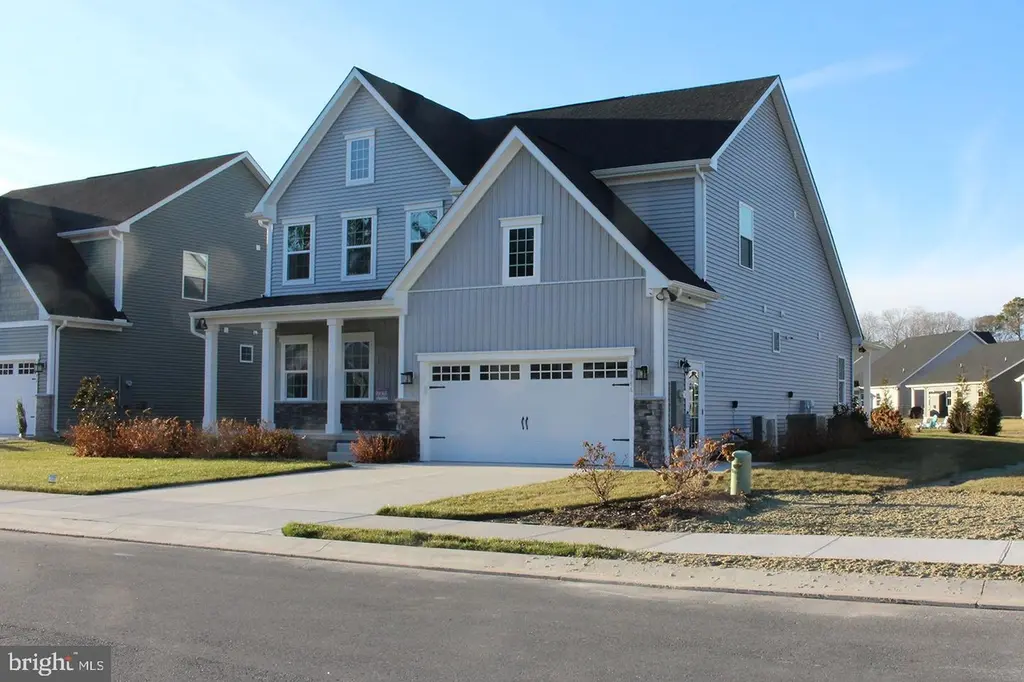
37946 Oneida Way S
Ocean View, DE 19945
$578,900D-
3 bd · 4.0 ba ·
1,480 sqft ·
Built 2023
· SingleFamily
· Active
· 191 DOM
Cashflow @ list (25.0% down · 7.5%)
Estimated rent
$2,372/mo
Mortgage (P&I)
−$3,036
Tax + insurance
−$354
HOA
−$166
Vac / Maint / Mgmt
−$498
Net cashflow
$-1,682/mo
Annual
$-20,186/yr
Cap rate
2.81%
Cash-on-cash
-12.45%
DSCR
0.45
1% rule
0.41%
Cash to close
$162,092
Investor read
- This is a 3-bed/4.0-bath single-family listed at $579k.
- At list price, monthly cash flow is $-2k ($-20k/yr) — negative.
- To cash-flow at today's rent, offer at most $282k (51.3% below list).
- To meet the 1% rule (rent ≥ 1% of price), the offer needs to be $237k (59.0% below list).
- It's been on market 191 days — a 12% lower offer ($509k) is reasonable based on typical stale-listing flexibility.
- Recommended offer: $237k (59.0% below list) — sets the bar for 1% rule.
- In year one you build about $62k of equity ($4k loan paydown + $58k appreciation (10.0% local appreciation)).
- Location reads 69/100 on livability (#27 in DE) — a middle-class / working-renter tenant base. Strengths: crime A+, employment A+, schools A; Watch: amenities F, commute F, cost of living F.
- Indian River School District (rural): math 25% / reading 41% proficiency, ranked #14 of 26 in DE (top 54%) — families likely to look elsewhere, expect single-tenant / working-renter base with shorter leases.
- Market conditions: 281 active listings in the ZIP; 5 comparable units currently listed for rent nearby; rentals lingering (median 44d on market — plan ~5-8 weeks vacancy on turnover, expect pricing pressure); 80% of comp listings sitting > 30 days — soft ceiling on asking rent; 4,354 units permitted in Sussex County in 2024 (344 in 5+ unit buildings).
- Sussex County population projected at +25% by 2050 — long-run rental-demand tailwind backs the buy-and-hold thesis.
- 5 sale attempts with the ask held roughly flat each time — persistent listings suggest the price (not the market) is what's stuck; bring a comps-based counter.
- By year 2, paydown + projected appreciation supports a ~$99k cash-out refi (75% LTV) — recoverable capital for the next deal without selling this one.
- Cap rate 2.8% vs local median 1.9% in Ocean View — top-decile yield for the area; either an underpriced asset or a hidden risk that comps aren't pricing in. Stress-test before assuming the spread holds.
Questions for listing agent
- What do current leases actually rent for vs. the listed asking? Can we see a recent rent roll and the last 12 months of T-12 income?
- It's been on market 191 days. Have you received any prior offers? Is the seller open to a 59% concession, seller financing, or rate buy-down credit?
- What does the HOA fee cover, when was the last increase, and are there any pending special assessments or reserve-fund shortfalls?
- Why hasn't it sold? Are there any deal-killer items the seller is aware of (foundation, flood, title, zoning, code violations)?
- Is there a deadline driving the sale (1031 exchange, divorce, estate, relocation)? That informs how much negotiation room exists.
- Schools are A-rated — typically a magnet for longer-tenancy family renters. What's the average tenant stay here, and is there a school-zone premium baked into asking?
- The area grade is low — what's the realistic commute time and amenity access for the typical tenant pool here? Any planned neighborhood developments (good or bad) we should know about?
- What's the average days-on-market for RENTAL listings here right now (not sales)? A rising rental-DOM trend means longer vacancies and softer asking-rent achievability than the comps imply.
CashFlowRE · CFR-0WMS2Z35PCV1Q8
· Data 2 days ago
cashflowre.app · 2026-05-29