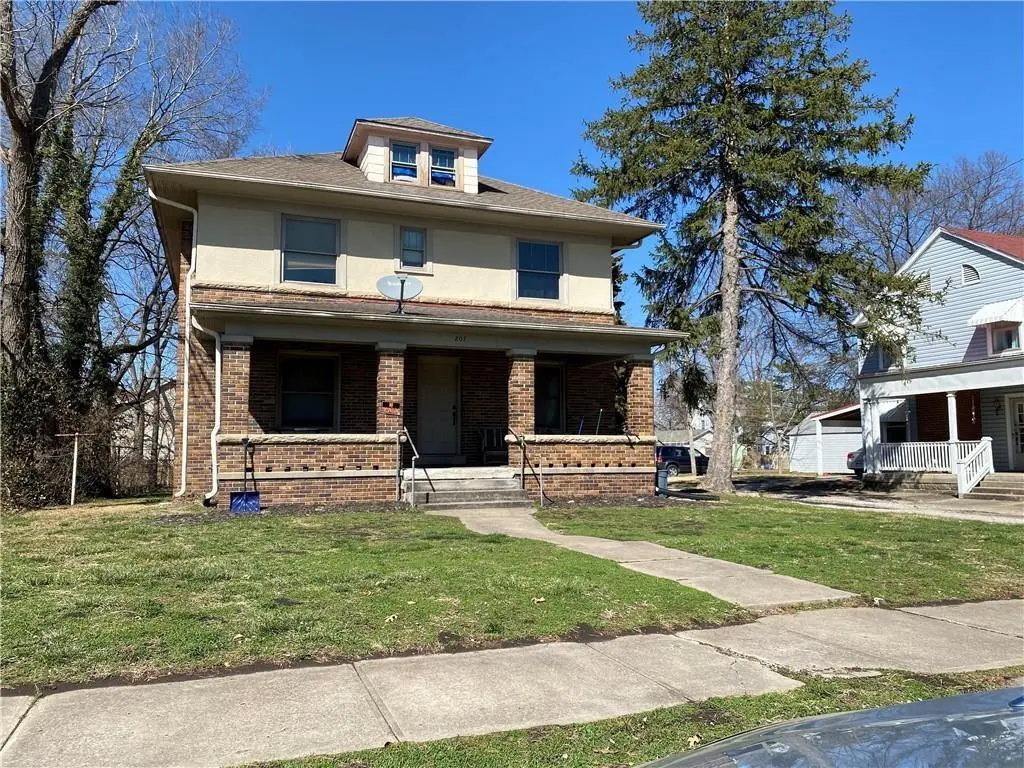
207 Broad St
Warrensburg, MO 64093
$260,000D
5 bd · 2.5 ba ·
3,794 sqft ·
Built 1914
· Other
· Active
· 53 DOM
Cashflow @ list (25.0% down · 7.5%)
Estimated rent
$1,758/mo
Mortgage (P&I)
−$1,363
Tax + insurance
−$236
HOA
−$0
Vac / Maint / Mgmt
−$369
Net cashflow
$-211/mo
Annual
$-2,536/yr
Cap rate
5.32%
Cash-on-cash
-3.48%
DSCR
0.84
1% rule
0.68%
Cash to close
$72,800
Investor read
- This is a 5-bed/2.5-bath other listed at $260k.
- At list price, monthly cash flow is $-211 ($-3k/yr) — negative.
- To cash-flow at today's rent, offer at most $223k (14.4% below list).
- To meet the 1% rule (rent ≥ 1% of price), the offer needs to be $176k (32.4% below list).
- It's been on market 53 days — a 3% lower offer ($252k) is reasonable based on typical stale-listing flexibility.
- Recommended offer: $176k (32.4% below list) — sets the bar for 1% rule.
- Local home prices are declining (-3.0%/yr); year-one equity from $2k of loan paydown is wiped out by about $8k of value loss. Plan a longer hold.
- Location reads 74/100 on livability (#71 in MO, #4,801 nationally) — a middle-class / working-renter tenant base. Strengths: cost of living A+, housing A+, health & safety A; Watch: crime D+, employment D+, commute F.
- Warrensburg R-VI (town): math 30% / reading 45% proficiency, ranked #184 of 324 in MO (top 57%) — families likely to look elsewhere, expect single-tenant / working-renter base with shorter leases.
- Watch-outs: built in 1914 — expect roof / HVAC / electrical / plumbing capex.
- Market conditions: Rents rising fast (+6.7%/yr); 270 active listings in the ZIP; 80 units permitted in Johnson County in 2024 (27 in 5+ unit buildings).
- Johnson County population projected at +6% by 2050 — modest demand growth; plan on rents tracking national, not racing it.
- 3 sale attempts since 16y ago with the ask held roughly flat each time — persistent listings suggest the price (not the market) is what's stuck; bring a comps-based counter.
- Climate carrying-cost: extreme-heat days projected 7→17/yr by 2055 (HVAC capex compounding) — expect insurance premiums to compound above CPI over the hold.
- Cap rate 5.3% vs local median 3.2% in Warrensburg — top-decile yield for the area; either an underpriced asset or a hidden risk that comps aren't pricing in. Stress-test before assuming the spread holds.
- This rent runs 35% of the median local income ($61k/yr) — at the standard rent-burdened threshold; future hikes will face affordability resistance.
Questions for listing agent
- What do current leases actually rent for vs. the listed asking? Can we see a recent rent roll and the last 12 months of T-12 income?
- It's been on market 53 days. Have you received any prior offers? Is the seller open to a 32% concession, seller financing, or rate buy-down credit?
- Built in 1914 — when were the roof, HVAC, electrical panel, plumbing, and water heater last replaced?
- Is there a deadline driving the sale (1031 exchange, divorce, estate, relocation)? That informs how much negotiation room exists.
- Schools are B-rated — typically a magnet for longer-tenancy family renters. What's the average tenant stay here, and is there a school-zone premium baked into asking?
- Crime grade is D in this area — have there been break-ins, vandalism, or insurance claims at this property in the last 3 years? What carrier currently insures it and at what premium?
- The area grade is low — what's the realistic commute time and amenity access for the typical tenant pool here? Any planned neighborhood developments (good or bad) we should know about?
- What's the average days-on-market for RENTAL listings here right now (not sales)? A rising rental-DOM trend means longer vacancies and softer asking-rent achievability than the comps imply.
CashFlowRE · CFR-0XM63T0ETGSAP4
· Data 1 day ago
cashflowre.app · 2026-05-29