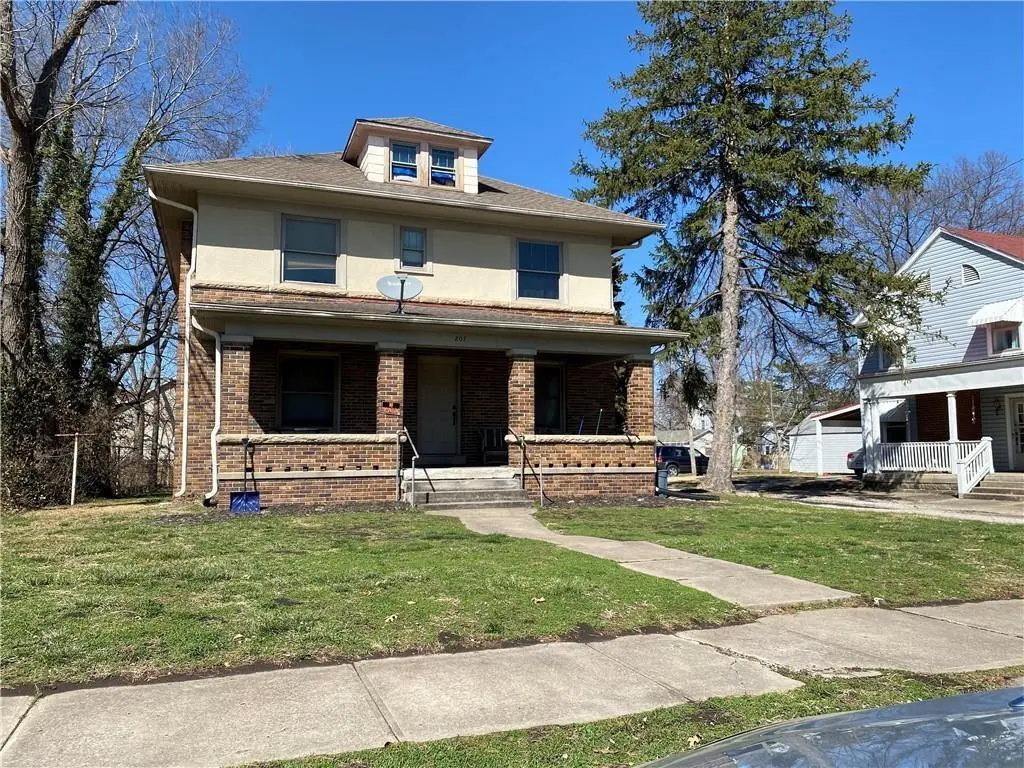
207 Broad St · Warrensburg, MO
Flood risk 1/10 · Minimal
- FEMA flood zone
- X (unshaded)
- Chance of flooding over 30 yrs
- 0.0%
- Est. flood insurance / yr
- $507 – $1,088
Fire risk 4/10 · Minor
- Est. fire insurance / yr
- $1,054 – $1,958
Heat risk 5/10 · Moderate
- Hot days now (above 109°F)
- 7 days/yr
- Hot days in 30 yrs
- 17 days/yr
Wind risk 2/10 · Minimal
- Chance of severe wind over 30 yrs
- —
Air-quality risk 1/10 · Minimal
- Unhealthy air days now
- 0 days/yr
- Unhealthy air days in 30 yrs
- 0 days/yr
Risk factors via First Street. Map © Google.
Why this score? — see what drove the D grade
The composite is a weighted blend of 9 inputs, each scored 0–100. Each bar is that input's sub-score; the figure is the points it added to the 100-point composite (weight × sub-score).
- ARV discount +14.5/15.0
- Cash flow +8.9/30.0
- Rent growth +4.2/5.0
- Livability +3.7/5.0
- Schools +3.2/10.0
- Condition / age +2.5/5.0
- DSCR +2.4/10.0
- 1% rule +1.8/10.0
- Appreciation +0.0/10.0
$260,000
🖨 Deal sheet 📄 Offer letter ✓ Due diligence
Listing remarks MLS
This home is located right across from UCM parking lot. Roll out of bed and be in class in five minutes! This five bedroom home is a home for five college boys at this time with rent of $2,125 split between the five. Utilities are paid by owner except for internet.
Key facts
- Brand new roof
- Covered patio
- Updated kitchen
Tags
Property features AI
Finance
- HOA & community: No association fees
Exterior
- Parking: Off-street parking; Other parking
- Utilities: Public water; Public sewer
- Home design: Single family residence; Residential property; 2 stories; Entry and rooms on multiple levels
- Construction: Brick/Mortar construction; Composition roof; Full basement
- Exterior features: Deck; Covered patio; City lot
Interior
- Kitchen: Granite counters; Ceramic tile; Dishwasher; Disposal; Refrigerator; Built-in oven
- Bedrooms: 5 bedrooms (located on main, second and third levels)
- Flooring: Carpet; Tile; Wood
- Bathrooms: 2 full bathrooms; 1 half bathroom; Ceramic tile in bathrooms; Shower-only in two bathrooms
- Heating & cooling: Natural gas heating; Electric cooling
- Interior features: Formal dining area; Built-in oven; Disposal; Dishwasher; Refrigerator; Has fireplace (gas)
- Laundry & utility: Laundry located in bathroom
Neighborhood map
What this means for you Summary
Snapshot
- This is a 5-bed/2.5-bath other listed at $260k.
Deal economics
- At list price, monthly cash flow is $-211 ($-3k/yr) — negative.
- To cash-flow at today's rent, offer at most $223k (14.4% below list).
- To meet the 1% rule (rent ≥ 1% of price), the offer needs to be $176k (32.4% below list).
- Recommended offer: $176k (32.4% below list) — sets the bar for 1% rule.
- Cap rate 5.3% vs local median 3.2% in Warrensburg — top-decile yield for the area; either an underpriced asset or a hidden risk that comps aren't pricing in. Stress-test before assuming the spread holds.
Location & tenants
- Location reads 74/100 on livability (#71 in MO, #4,801 nationally) — a middle-class / working-renter tenant base. Strengths: cost of living A+, housing A+, health & safety A; Watch: crime D+, employment D+, commute F.
- Warrensburg R-VI (town): math 30% / reading 45% proficiency, ranked #184 of 324 in MO (top 57%) — families likely to look elsewhere, expect single-tenant / working-renter base with shorter leases.
- Market conditions: Rents rising fast (+6.7%/yr); 270 active listings in the ZIP; 80 units permitted in Johnson County in 2024 (27 in 5+ unit buildings).
- This rent runs 35% of the median local income ($61k/yr) — at the standard rent-burdened threshold; future hikes will face affordability resistance.
Forward outlook
- Local home prices are declining (-3.0%/yr); year-one equity from $2k of loan paydown is wiped out by about $8k of value loss. Plan a longer hold.
- Johnson County population projected at +6% by 2050 — modest demand growth; plan on rents tracking national, not racing it.
Negotiation context
- It's been on market 53 days — a 3% lower offer ($252k) is reasonable based on typical stale-listing flexibility.
- 3 sale attempts since 16y ago with the ask held roughly flat each time — persistent listings suggest the price (not the market) is what's stuck; bring a comps-based counter.
Risks & watch-outs
- Watch-outs: built in 1914 — expect roof / HVAC / electrical / plumbing capex.
- Climate carrying-cost: extreme-heat days projected 7→17/yr by 2055 (HVAC capex compounding) — expect insurance premiums to compound above CPI over the hold.
Questions for the listing agent
- What do current leases actually rent for vs. the listed asking? Can we see a recent rent roll and the last 12 months of T-12 income?
- It's been on market 53 days. Have you received any prior offers? Is the seller open to a 32% concession, seller financing, or rate buy-down credit?
- Built in 1914 — when were the roof, HVAC, electrical panel, plumbing, and water heater last replaced?
- Is there a deadline driving the sale (1031 exchange, divorce, estate, relocation)? That informs how much negotiation room exists.
- Schools are B-rated — typically a magnet for longer-tenancy family renters. What's the average tenant stay here, and is there a school-zone premium baked into asking?
- Crime grade is D in this area — have there been break-ins, vandalism, or insurance claims at this property in the last 3 years? What carrier currently insures it and at what premium?
- The area grade is low — what's the realistic commute time and amenity access for the typical tenant pool here? Any planned neighborhood developments (good or bad) we should know about?
- What's the average days-on-market for RENTAL listings here right now (not sales)? A rising rental-DOM trend means longer vacancies and softer asking-rent achievability than the comps imply.
- What's the recent tenant-quality profile in this submarket — average credit score on applications, eviction rate, late-payment / NSF rate, and stable-employment percentage? A property-management company in the area should have these aggregated.
- How much new for-sale + rental construction is in the pipeline within 1–3 miles? Heavy new supply typically softens prices + rents 12–24 months out; constrained supply supports both.
Investment metrics
- 1% rule
- 0.68% ✗
- Cap rate
- 5.32%
- Cash-on-cash
- -3.48%
- DSCR
- 0.84
- GRM
- 12.3
CMA / ARV
- ARV (median comp)
- $308,153
- List price
- $260,000
- Delta
- -15.63%
- Verdict
- UNDERPRICED
- Comps
- 20 within 1.0 mi
Projected returns pro-forma
-3.0% appreciation · 6.68% rent growth · sell at horizon
- IRR
- -18.6%
- Equity multiple
- 0.33×
- Total profit
- $-48,938
- Equity at exit
- $38,767
- IRR
- -5.7%
- Equity multiple
- 0.58×
- Total profit
- $-30,458
- Equity at exit
- $22,480
Cash invested: $72,800 (down + closing). Projections, not guarantees.
Landlord ↔ Tenant lean methodology
- Overall (STATE)
- 81 Strongly Landlord-Friendly
- State Missouri
- 81 Strongly Landlord-Friendly · R+10
- County
- — inherits STATE
- City
- — inherits STATE
ZIP-level market 64093
- Home prices YoY
- -33.4%
- Rents YoY
- 6.7%
- Active inventory
- 270
- Price-to-rent
- 12.3×
Monthly cashflow live
- Estimated rent
- $1,758 medium interval (Pro) →
- Mortgage (P&I)
- −$1,363
- Tax from tax record
- −$128 /mo · $1,537/yr
- Insurance
- −$108
- HOA
- −$0
- Vacancy / Maint / Mgmt
- −$369
- Net cashflow
- $-211
Break-even live
UW: 25.0% down · 7.5% · 30yr · 1.5% tax · 5.0% vac · 8.0% maint · 8.0% mgmt
Financing live
Cash to close
- Down payment
- $65,000
- Closing costs
- $7,800
- Reserves months
- —
- Total cash needed
- —
Loan-product check · same deal, 3 products live
Conventional
25% down · 7.5% · 30yr
- Down + closing
- —
- Monthly P&I
- —
- Monthly cashflow
- —
- DSCR
- —
- Eligible?
- —
Personal DTI + credit; lowest rate.
DSCR
20% down · 8.5% · 30yr
- Down + closing
- —
- Monthly P&I
- —
- Monthly cashflow
- —
- DSCR
- —
- Eligible?
- —
No personal income docs; deal must DSCR.
Hard money
10% down · 12.0% · 12mo
- Down + closing
- —
- Monthly P&I
- —
- Monthly cashflow
- —
- DSCR
- —
- Eligible?
- —
Short-term bridge; refi at stabilization.
Listing history 24 events
-
2026-06-19days on market $260,000 Active 53 DOM
-
2026-06-18days on market $260,000 Active 52 DOM
-
2026-06-17days on market $260,000 Active 51 DOM
-
2026-06-16days on market $260,000 Active 50 DOM
-
2026-06-15days on market $260,000 Active 49 DOM
-
2026-06-14days on market $260,000 Active 47 DOM
-
2026-06-12days on market $260,000 Active 46 DOM
-
2026-06-09days on market $260,000 Active 43 DOM
-
2026-06-08days on market $260,000 Active 42 DOM
-
2026-06-07days on market $260,000 Active 41 DOM
-
2026-06-03days on market $260,000 Active 37 DOM
-
2026-06-02days on market $260,000 Active 36 DOM
-
2026-06-01days on market $260,000 Active 35 DOM
-
2026-05-31days on market $260,000 Active 34 DOM
-
2026-05-30days on market $260,000 Active 33 DOM
-
2026-04-27$260,000 Active 920-char remark
-
2022-05-04soldstatus
-
2022-05-03soldstatus Closed 266-char remark
Show marketing remark (266 chars)
This home is located right across from UCM parking lot. Roll out of bed and be in class in five minutes! This five bedroom home is a home for five college boys at this time with rent of $2,125 split between the five. Utilities are paid by owner except for internet.
-
2022-03-25status Pending 266-char remark
Show marketing remark (266 chars)
This home is located right across from UCM parking lot. Roll out of bed and be in class in five minutes! This five bedroom home is a home for five college boys at this time with rent of $2,125 split between the five. Utilities are paid by owner except for internet.
-
2022-03-20$230,000 Active 266-char remark
Show marketing remark (266 chars)
This home is located right across from UCM parking lot. Roll out of bed and be in class in five minutes! This five bedroom home is a home for five college boys at this time with rent of $2,125 split between the five. Utilities are paid by owner except for internet.
-
2010-11-16soldstatus
Show marketing remark (299 chars)
SLEEP LATE AND MAKE IT TO CLASS. NICE OLDER HOME W/ THIRD FLOOR ROOM. RIGHT ACROSS FROM UNIVERSITY PARKING LOT. HOUSE NEEDS SOME "FOO-FOO" BUT A GREAT LOCATION TO THE UNIVERSITY. 4 SPACIOUS BEDROOMS ON SECOND FLOOR. GREAT LONG LIVING ROOM WITH MANY BOOKSHELVES IN LIVING ROOM, DINING ROOM.
-
2010-11-01soldstatus
-
2010-08-12$89,500
Show marketing remark (299 chars)
SLEEP LATE AND MAKE IT TO CLASS. NICE OLDER HOME W/ THIRD FLOOR ROOM. RIGHT ACROSS FROM UNIVERSITY PARKING LOT. HOUSE NEEDS SOME "FOO-FOO" BUT A GREAT LOCATION TO THE UNIVERSITY. 4 SPACIOUS BEDROOMS ON SECOND FLOOR. GREAT LONG LIVING ROOM WITH MANY BOOKSHELVES IN LIVING ROOM, DINING ROOM.
-
1998-10-01soldstatus
ⓘ Source: listings_history table (triggers on properties + properties_extension) + one-shot
backfill from property_details.listing_events for pre-trigger history.
Tax reassessment forecast MO · Resets to sale price
- Current annual tax
- $1,537 · $128/mo
- Projected year-2 tax
- $2,522 · $210/mo
- Expected delta
- +$985/yr (+$82/mo · 64.1%)
ⓘ Screening estimate from a state-policy table — verify with the county assessor before closing.
Climate risk First Street
- Flood 1/10 Low FEMA zone X (unshaded) · 0% chance over 30 yrs
- Wildfire 4/10 Moderate
- Heat 5/10 Major 7 d/yr ≥109°F today · 17 d/yr by 30 yrs out
- Wind 2/10 Low
- Air quality 1/10 Low 0 unhealthy d/yr today · 0 by 30 yrs out
Nearby sold comps map
Loading sold comps map…
Walkable amenities ~0.75 mi
Loading nearby amenities…
Taxation est. · year 1
- Rental income
- $21,092
- − Mortgage interest
- −$14,564
- − Property taxes
- −$1,537
- − Insurance
- −$1,300
- − Repairs & maintenance
- −$1,687
- − Management
- −$1,687
- − Depreciation
- −$7,564
- Taxable loss
- −$7,248
- Est. tax savings @ 24.0%
- +$1,739
- After-tax cash flow
- $-797/yr
For passive investors: Depreciation is non-cash, so a rental often shows a tax loss while cash-flowing — sheltering income. Rental losses are passive: they offset passive income freely, and up to $25,000/yr can offset ordinary (W-2) income if you actively participate and your MAGI is under $100k (phasing out to $0 by $150k); unused losses carry forward. On sale, claimed depreciation is recaptured at up to 25%, and gains may owe capital-gains tax (a 1031 exchange can defer both). Figures are a year-1 estimate at your 24.0% rate — not tax advice; consult a CPA.
Schools (NCES district)
- District
- Warrensburg R-VI
- NCES district ID
- 2931020
- Math proficiency
- 30% ▼ -11.00%
- Reading proficiency
- 45% ▼ -11.00%
- Median HH income
- $43,760
- Composite
- 31.77/100
- National rank
- #5895
- State rank
- #184 of 324 in MO
Livability — Warrensburg
- Score
- 74/100
- State rank
- #71
- US rank
- #4801
Category grades
Schools grade is shown separately in the Schools card above.
Census & demographics
- Census place
- Warrensburg, MO
- County
- Johnson County · 34,718 people
- City population
- 28,199
- Metro
- Warrensburg, MO
- Population (ZIP)
- 28,199
- Household income
- $61,094
- Rent vs Own
- Severe rent burden
- 855.0
Population outlook (Johnson County) Hauer SSP2
- Today (2025)
- 55,794 people
- By 2030
- 56,861 · +1.9%
- By 2040
- 58,239 · +4.4%
- By 2050
- 59,168 · +6.0%
- By 2075
- 62,222 · +11.5%
- By 2100
- 60,118 · +7.7%
Race, ethnicity, and origin ACS 2023
- Neighborhood character
- Predominantly White (84%)
- Race & ethnicity
- White 84% Two or more races 5% Hispanic / Latino 5% Black 4% Asian 2%
- Common ancestry
- Slovak 2% Italian 2% Serbian 2%
- Foreign-born
- 2% · South Korea
- Languages at home
- 95% English-only · Spanish 2% Other Asian/Pacific 1% Other Indo-European 1%
Political lean MEDSL · Johnson
- 2024 margin
- Solid R (+39.6) · D 29.5% · R 69.1% · Other 1.4%
- 2008→2024 swing
- -27.3pp toward R · 2008: -12.2pp · 2024: -39.6pp
- All cycles
- 2024: R+39.6 2020: R+36.8 2016: R+36.9 2012: R+24.2 2008: R+12.2
Not yet ingested
- Civics
- —
Market trends
- HPI YoY
- ▼ -90.22%
- Current HPI
- 179.7251
- Rent YoY
- ▲ 6.68%
- Metro
- Warrensburg, MO
- State GDP YoY
- ▲ 1.84%
- F500 in state
- 20
Industry mix (Fortune 500 HQ in MO)
| Industry | F500 HQs | Revenue |
|---|---|---|
| Healthcare | 1 | $163B |
|
||
| Insurance | 1 | $21B |
|
||
| Industrial Technology | 1 | $17B |
|
||
| Retail | 1 | $16B |
|
||
| Industrial Distribution | 1 | $10B |
|
||
| Utilities | 1 | $9B |
|
||
Price history
+190.5% since first listed9 events — show timeline
- 2026-04-27 Listed $260,000 Heartland MLS as Distributed by MLS Grid
- 2022-05-04 Sold (Public Records) — Public Records
- 2022-05-03 Sold (MLS) — Heartland MLS as Distributed by MLS Grid
- 2022-03-25 Pending — Heartland MLS as Distributed by MLS Grid
- 2022-03-20 Listed $230,000 Heartland MLS as Distributed by MLS Grid
- 2010-11-16 Sold (MLS) — Heartland MLS as Distributed by MLS Grid
- 2010-11-01 Sold (Public Records) — Public Records
- 2010-08-12 Listed $89,500 Heartland MLS as Distributed by MLS Grid
- 1998-10-01 Sold (Public Records) — Public Records
Property tax history
+2.9%/yrLatest (2025): $1,537 · +7.1% YoY. Source: county tax records.
Cash-flow waterfall
monthlySold comps — $/sqft
last 12 mo · ≤1 miLoading sold comps…