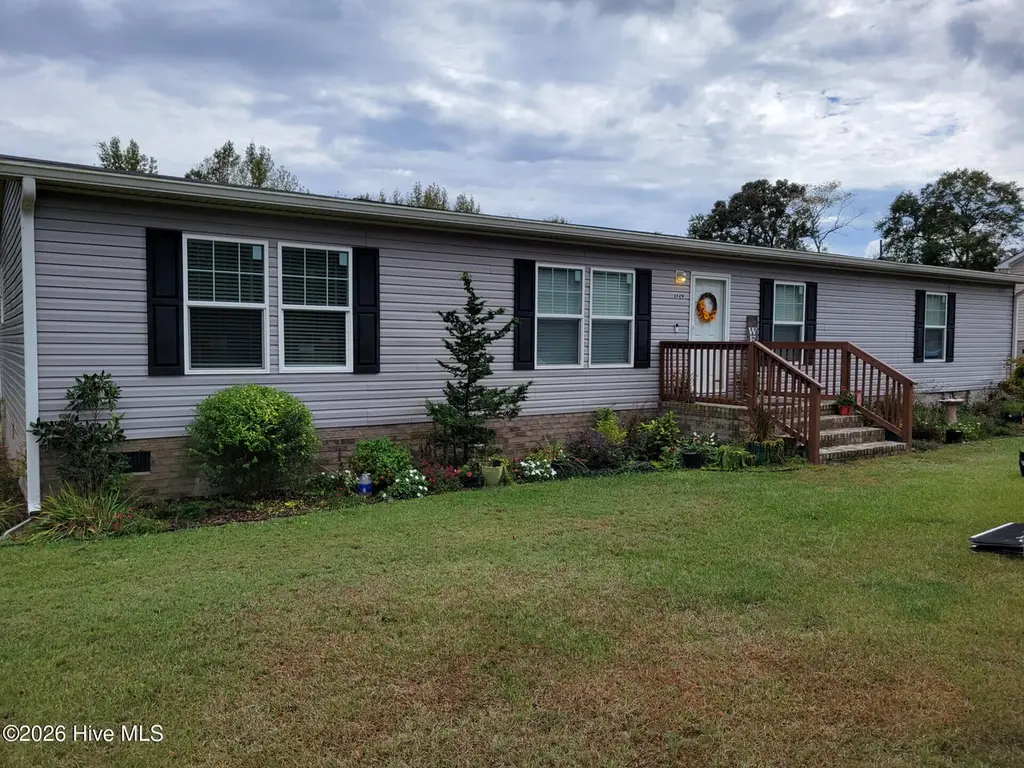
3729 Bryan Hardy Rd
La Grange, NC 28551
$245,000D-
3 bd · 2.0 ba ·
1,890 sqft ·
Built 2022
· Other
· Active
· 30 DOM
Cashflow @ list (25.0% down · 7.5%)
Estimated rent
$1,849/mo
Mortgage (P&I)
−$1,285
Tax + insurance
−$256
HOA
−$0
Vac / Maint / Mgmt
−$388
Net cashflow
$-80/mo
Annual
$-959/yr
Cap rate
5.90%
Cash-on-cash
-1.40%
DSCR
0.94
1% rule
0.75%
Cash to close
$68,600
Investor read
- This is a 3-bed/2.0-bath other listed at $245k.
- At list price, monthly cash flow is $-80 ($-959/yr) — negative.
- To cash-flow at today's rent, offer at most $231k (5.8% below list).
- To meet the 1% rule (rent ≥ 1% of price), the offer needs to be $185k (24.5% below list).
- It's been on market 30 days — a 2% lower offer ($241k) is reasonable based on typical stale-listing flexibility.
- Recommended offer: $185k (24.5% below list) — sets the bar for 1% rule.
- Local home prices are declining (-3.0%/yr); year-one equity from $2k of loan paydown is wiped out by about $7k of value loss. Plan a longer hold.
- Location reads 66/100 on livability (#278 in NC) — a middle-class / working-renter tenant base. Strengths: crime A+, cost of living A+, housing A+; Watch: amenities F, commute F, health & safety F.
- Lenoir County Public Schools (rural): math 29% / reading 32% proficiency, ranked #147 of 178 in NC (top 83%) — families likely to look elsewhere, expect single-tenant / working-renter base with shorter leases; 65% free/reduced lunch — lower-income household profile, screen leases tightly.
- Zoned schools: La Grange Elementary (math 32% / reading 32%, grade F, #908 of 1,410 statewide, top 67%, 498 students, 99% FRL); E B Frink Middle (math 35% / reading 35%, grade F, #286 of 475 statewide, top 61%, 540 students, 99% FRL); North Lenoir High (math 52% / reading 36%, grade F, #367 of 535 statewide, top 69%, 975 students, 100% FRL) — zoned schools average 100% FRL vs 65% district-wide (35 pts higher); higher-poverty schools than district average — tighter screening recommended.
- Market conditions: 86 active listings in the ZIP; 148 units permitted in Lenoir County in 2024 (0 in 5+ unit buildings).
- Lenoir County population projected at -18% by 2050 — secular population decline; favor cash flow + early exit over multi-decade hold.
- 3 sale attempts with the ask held roughly flat each time — persistent listings suggest the price (not the market) is what's stuck; bring a comps-based counter.
- Cap rate 5.9% vs local median 4.3% in La Grange — top-decile yield for the area; either an underpriced asset or a hidden risk that comps aren't pricing in. Stress-test before assuming the spread holds.
Questions for listing agent
- What do current leases actually rent for vs. the listed asking? Can we see a recent rent roll and the last 12 months of T-12 income?
- Is there a deadline driving the sale (1031 exchange, divorce, estate, relocation)? That informs how much negotiation room exists.
- Schools are F-rated, which usually means shorter tenancies and higher turnover. Who's the typical renter profile here, and what's been the actual vacancy rate?
- The area grade is low — what's the realistic commute time and amenity access for the typical tenant pool here? Any planned neighborhood developments (good or bad) we should know about?
- What's the average days-on-market for RENTAL listings here right now (not sales)? A rising rental-DOM trend means longer vacancies and softer asking-rent achievability than the comps imply.
- What's the recent tenant-quality profile in this submarket — average credit score on applications, eviction rate, late-payment / NSF rate, and stable-employment percentage? A property-management company in the area should have these aggregated.
- How much new for-sale + rental construction is in the pipeline within 1–3 miles? Heavy new supply typically softens prices + rents 12–24 months out; constrained supply supports both.
CashFlowRE · CFR-0XPK1CDT42TJPR
· Data 1 day ago
cashflowre.app · 2026-05-29