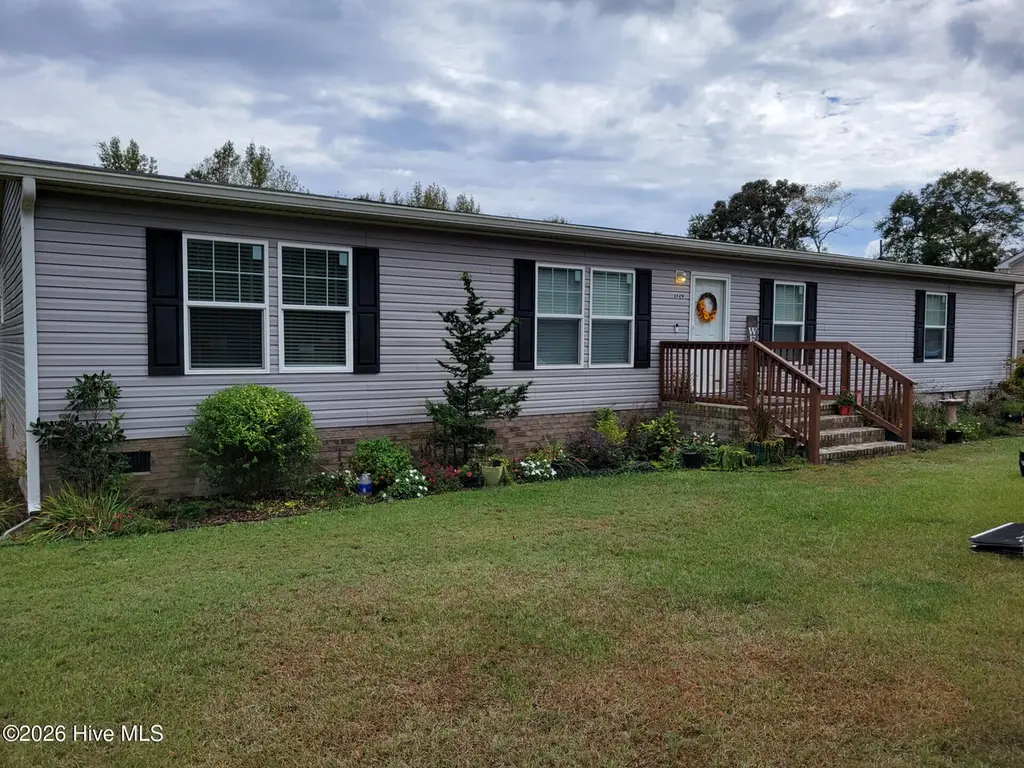
3729 Bryan Hardy Rd · La Grange, NC
Flood risk No data
- FEMA flood zone
- —
- Chance of flooding over 30 yrs
- —
- Est. flood insurance / yr
- —
Fire risk No data
- Est. fire insurance / yr
- —
Heat risk No data
- Hot days now (above threshold)
- —
- Hot days in 30 yrs
- —
Wind risk No data
- Chance of severe wind over 30 yrs
- —
Air-quality risk No data
- Unhealthy air days now
- —
- Unhealthy air days in 30 yrs
- —
Risk factors via First Street. Map © Google.
Why this score? — see what drove the D- grade
The composite is a weighted blend of 9 inputs, each scored 0–100. Each bar is that input's sub-score; the figure is the points it added to the 100-point composite (weight × sub-score).
- Cash flow +11.5/30.0
- ARV discount +7.5/15.0
- DSCR +3.4/10.0
- Livability +3.3/5.0
- 1% rule +2.5/10.0
- Rent growth +2.5/5.0
- Schools +2.5/10.0
- Condition / age +2.5/5.0
- Appreciation +0.0/10.0
$245,000
🖨 Deal sheet 📄 Offer letter ✓ Due diligence
Listing remarks
Welcome to this newly constructed single family home located at 3729 Bryan Hardy Road in La Grange, NC. Built in 2022, this modern and stylish home boasts a total of 2 bathrooms, with no half bathrooms, and a spacious finished area of 1,886 square feet. The lot size of this property is 1.97 acres, offering plenty of outdoor space for relaxation and entertainment. This charming home features a well-designed floor plan that includes an inviting living room with open floor plan. Opens right into the kitchen with plenty of counter and storage space. The bedrooms are spacious and offer ample closet space for storage. Conveniently located between Kinston and Goldsboro. Only 24 min drive to Seymou
Key facts
- Newly constructed
- Open floor plan
- Ample closet space
Tags
Property features AI
Exterior
- Parking: On-site parking
- Utilities: Public water; Water connected; Private sewer
- Home design: Manufactured home; Single-story / One level; Entry level: 1
- Construction: Vinyl siding with frame construction; Composition roof; Permanent foundation; Built as a manufactured home
- Exterior features: Deck; Porch; Shed(s); Has a view; Partial fencing with wire, chain link and wood in the backyard
Interior
- Kitchen: Self-cleaning oven; Refrigerator; Ice maker; Dishwasher; Microwave; Kitchen island
- Bedrooms: Master downstairs
- Flooring: Carpet; Vinyl
- Bathrooms: 2 full bathrooms; Accessible full bathroom
- Heating & cooling: Central air; Electric heating; Heat pump
- Interior features: Master suite on the main level; Walk-in closet(s); Kitchen island; Ceiling fan(s); Unfurnished
- Laundry & utility: Washer hookup
Neighborhood map
What this means for you Summary
Snapshot
- This is a 3-bed/2.0-bath other listed at $245k.
Deal economics
- At list price, monthly cash flow is $-80 ($-959/yr) — negative.
- To cash-flow at today's rent, offer at most $231k (5.8% below list).
- To meet the 1% rule (rent ≥ 1% of price), the offer needs to be $185k (24.5% below list).
- Recommended offer: $185k (24.5% below list) — sets the bar for 1% rule.
- Cap rate 5.9% vs local median 4.3% in La Grange — top-decile yield for the area; either an underpriced asset or a hidden risk that comps aren't pricing in. Stress-test before assuming the spread holds.
Location & tenants
- Location reads 66/100 on livability (#278 in NC) — a middle-class / working-renter tenant base. Strengths: crime A+, cost of living A+, housing A+; Watch: amenities F, commute F, health & safety F.
- Lenoir County Public Schools (rural): math 29% / reading 32% proficiency, ranked #147 of 178 in NC (top 83%) — families likely to look elsewhere, expect single-tenant / working-renter base with shorter leases; 65% free/reduced lunch — lower-income household profile, screen leases tightly.
- Zoned schools: La Grange Elementary (math 32% / reading 32%, grade F, #908 of 1,410 statewide, top 67%, 498 students, 99% FRL); E B Frink Middle (math 35% / reading 35%, grade F, #286 of 475 statewide, top 61%, 540 students, 99% FRL); North Lenoir High (math 52% / reading 36%, grade F, #367 of 535 statewide, top 69%, 975 students, 100% FRL) — zoned schools average 100% FRL vs 65% district-wide (35 pts higher); higher-poverty schools than district average — tighter screening recommended.
- Market conditions: 86 active listings in the ZIP; 148 units permitted in Lenoir County in 2024 (0 in 5+ unit buildings).
Forward outlook
- Local home prices are declining (-3.0%/yr); year-one equity from $2k of loan paydown is wiped out by about $7k of value loss. Plan a longer hold.
- Lenoir County population projected at -18% by 2050 — secular population decline; favor cash flow + early exit over multi-decade hold.
Negotiation context
- It's been on market 30 days — a 2% lower offer ($241k) is reasonable based on typical stale-listing flexibility.
- 3 sale attempts with the ask held roughly flat each time — persistent listings suggest the price (not the market) is what's stuck; bring a comps-based counter.
Questions for the listing agent
- What do current leases actually rent for vs. the listed asking? Can we see a recent rent roll and the last 12 months of T-12 income?
- Is there a deadline driving the sale (1031 exchange, divorce, estate, relocation)? That informs how much negotiation room exists.
- Schools are F-rated, which usually means shorter tenancies and higher turnover. Who's the typical renter profile here, and what's been the actual vacancy rate?
- The area grade is low — what's the realistic commute time and amenity access for the typical tenant pool here? Any planned neighborhood developments (good or bad) we should know about?
- What's the average days-on-market for RENTAL listings here right now (not sales)? A rising rental-DOM trend means longer vacancies and softer asking-rent achievability than the comps imply.
- What's the recent tenant-quality profile in this submarket — average credit score on applications, eviction rate, late-payment / NSF rate, and stable-employment percentage? A property-management company in the area should have these aggregated.
- How much new for-sale + rental construction is in the pipeline within 1–3 miles? Heavy new supply typically softens prices + rents 12–24 months out; constrained supply supports both.
Investment metrics
- 1% rule
- 0.75% ✗
- Cap rate
- 5.90%
- Cash-on-cash
- -1.40%
- DSCR
- 0.94
- GRM
- 11.0
CMA / ARV
No comps found within radius.
Projected returns pro-forma
-3.0% appreciation · 3.0% rent growth · sell at horizon
- IRR
- -18.6%
- Equity multiple
- 0.35×
- Total profit
- $-44,854
- Equity at exit
- $36,530
- IRR
- -11.1%
- Equity multiple
- 0.33×
- Total profit
- $-45,878
- Equity at exit
- $21,183
Cash invested: $68,600 (down + closing). Projections, not guarantees.
Landlord ↔ Tenant lean methodology
- Overall (STATE)
- 85 Strongly Landlord-Friendly
- State North Carolina
- 85 Strongly Landlord-Friendly · R+3
- County
- — inherits STATE
- City
- — inherits STATE
ZIP-level market 28551
- Home prices YoY
- -16.2%
- Active inventory
- 86
- Price-to-rent
- 11.0×
Monthly cashflow live
- Estimated rent
- $1,849 medium interval (Pro) →
- Mortgage (P&I)
- −$1,285
- Tax from tax record
- −$154 /mo · $1,843/yr
- Insurance
- −$102
- HOA
- −$0
- Vacancy / Maint / Mgmt
- −$388
- Net cashflow
- $-80
Break-even live
UW: 25.0% down · 7.5% · 30yr · 1.5% tax · 5.0% vac · 8.0% maint · 8.0% mgmt
Financing live
Cash to close
- Down payment
- $61,250
- Closing costs
- $7,350
- Reserves months
- —
- Total cash needed
- —
Loan-product check · same deal, 3 products live
Conventional
25% down · 7.5% · 30yr
- Down + closing
- —
- Monthly P&I
- —
- Monthly cashflow
- —
- DSCR
- —
- Eligible?
- —
Personal DTI + credit; lowest rate.
DSCR
20% down · 8.5% · 30yr
- Down + closing
- —
- Monthly P&I
- —
- Monthly cashflow
- —
- DSCR
- —
- Eligible?
- —
No personal income docs; deal must DSCR.
Hard money
10% down · 12.0% · 12mo
- Down + closing
- —
- Monthly P&I
- —
- Monthly cashflow
- —
- DSCR
- —
- Eligible?
- —
Short-term bridge; refi at stabilization.
Listing history 22 events
-
2026-06-19days on market $245,000 Active 30 DOM
-
2026-06-18days on market $245,000 Active 29 DOM
-
2026-06-17days on market $245,000 Active 28 DOM
-
2026-06-16days on market $245,000 Active 27 DOM
-
2026-06-15days on market $245,000 Active 26 DOM
-
2026-06-14days on market $245,000 Active 24 DOM
-
2026-06-12days on market $245,000 Active 23 DOM
-
2026-06-09days on market $245,000 Active 20 DOM
-
2026-06-08days on market $245,000 Active 19 DOM
-
2026-06-07days on market $245,000 Active 18 DOM
-
2026-06-07days on market $245,000 Active 17 DOM
-
2026-06-04days on market $245,000 Active 14 DOM
-
2026-06-02days on market $245,000 Active 13 DOM
-
2026-06-01days on market $245,000 Active 12 DOM
-
2026-05-31days on market $245,000 Active 11 DOM
-
2026-05-31days on market $245,000 Active 10 DOM
-
2026-05-20$245,000 Active
-
2026-05-08historical
-
2026-05-01status Active
-
2026-04-30historical
-
2025-11-29price $255,000
-
2025-11-01$260,000 Active
ⓘ Source: listings_history table (triggers on properties + properties_extension) + one-shot
backfill from property_details.listing_events for pre-trigger history.
Tax reassessment forecast NC · Resets to sale price
- Current annual tax
- $1,843 · $154/mo
- Projected year-2 tax
- $2,009 · $167/mo
- Expected delta
- +$166/yr (+$14/mo · 9.0%)
ⓘ Screening estimate from a state-policy table — verify with the county assessor before closing.
Nearby sold comps map
Loading sold comps map…
Walkable amenities ~0.75 mi
Loading nearby amenities…
Taxation est. · year 1
- Rental income
- $22,186
- − Mortgage interest
- −$13,724
- − Property taxes
- −$1,843
- − Insurance
- −$1,225
- − Repairs & maintenance
- −$1,775
- − Management
- −$1,775
- − Depreciation
- −$7,127
- Taxable loss
- −$5,283
- Est. tax savings @ 24.0%
- +$1,268
- After-tax cash flow
- $309/yr
For passive investors: Depreciation is non-cash, so a rental often shows a tax loss while cash-flowing — sheltering income. Rental losses are passive: they offset passive income freely, and up to $25,000/yr can offset ordinary (W-2) income if you actively participate and your MAGI is under $100k (phasing out to $0 by $150k); unused losses carry forward. On sale, claimed depreciation is recaptured at up to 25%, and gains may owe capital-gains tax (a 1031 exchange can defer both). Figures are a year-1 estimate at your 24.0% rate — not tax advice; consult a CPA.
Schools (NCES district)
- District
- Lenoir County Public Schools
- NCES district ID
- 3702610
- Math proficiency
- 29% ▲ 1.00%
- Reading proficiency
- 32% ▼ -4.00%
- Median HH income
- $34,958
- Composite
- 25.17/100
- National rank
- #7515
- State rank
- #147 of 178 in NC
Livability — La Grange
- Score
- 66/100
- State rank
- #278
- US rank
- #12047
Category grades
Schools grade is shown separately in the Schools card above.
Census & demographics
- Population (ZIP)
- 13,264
Population outlook (Lenoir County) Hauer SSP2
- Today (2025)
- 55,002 people
- By 2030
- 53,048 · -3.6%
- By 2040
- 49,041 · -10.8%
- By 2050
- 45,136 · -17.9%
- By 2075
- 36,547 · -33.6%
- By 2100
- 27,731 · -49.6%
Race, ethnicity, and origin ACS 2023
- Neighborhood character
- Diverse neighborhood (Simpson 0.62)
- Race & ethnicity
- White 56% Black 21% Hispanic / Latino 16% Two or more races 8%
- Hispanic origin (detail)
- Mexican 14%
- Common ancestry
- Slovak 1% Portuguese 1% Slovene 1%
- Foreign-born
- 5% · Canada
- Languages at home
- 87% English-only · Spanish 12%
Political lean MEDSL · Lenoir
- 2024 margin
- Lean R (+6.8) · D 46.2% · R 53.0%
- 2008→2024 swing
- -6.7pp toward R · 2008: -0.1pp · 2024: -6.8pp
- All cycles
- 2024: R+6.8 2020: R+3.5 2016: R+6.3 2012: R+1.5 2008: R+0.1
Not yet ingested
- Civics
- —
Market trends
- HPI YoY
- ▼ -41.90%
- Current HPI
- 216.483
- Rent YoY
- —
- Metro
- —
- State GDP YoY
- ▲ 3.28%
- F500 in state
- 26
Industry mix (Fortune 500 HQ in NC)
| Industry | F500 HQs | Revenue |
|---|---|---|
| Financial Services | 2 | $213B |
|
||
| Retail | 2 | $95B |
|
||
| Industrial Conglomerate | 1 | $38B |
|
||
| Metals / Steel | 1 | $35B |
|
||
| Utilities | 1 | $30B |
|
||
| Industrial Machinery | 1 | $19B |
|
||
Price history
-5.8% since first listed6 events — show timeline
- 2026-05-20 Listed $245,000 Hive MLS
- 2026-05-08 Listing Removed — Hive MLS
- 2026-05-01 Relisted — Hive MLS
- 2026-04-30 Listing Removed — Hive MLS
- 2025-11-29 Price Changed $255,000 Hive MLS
- 2025-11-01 Listed $260,000 Hive MLS
Property tax history
+110.6%/yrLatest (2025): $1,843 · +110.6% YoY. Source: county tax records.
Cash-flow waterfall
monthlySold comps — $/sqft
last 12 mo · ≤1 miLoading sold comps…