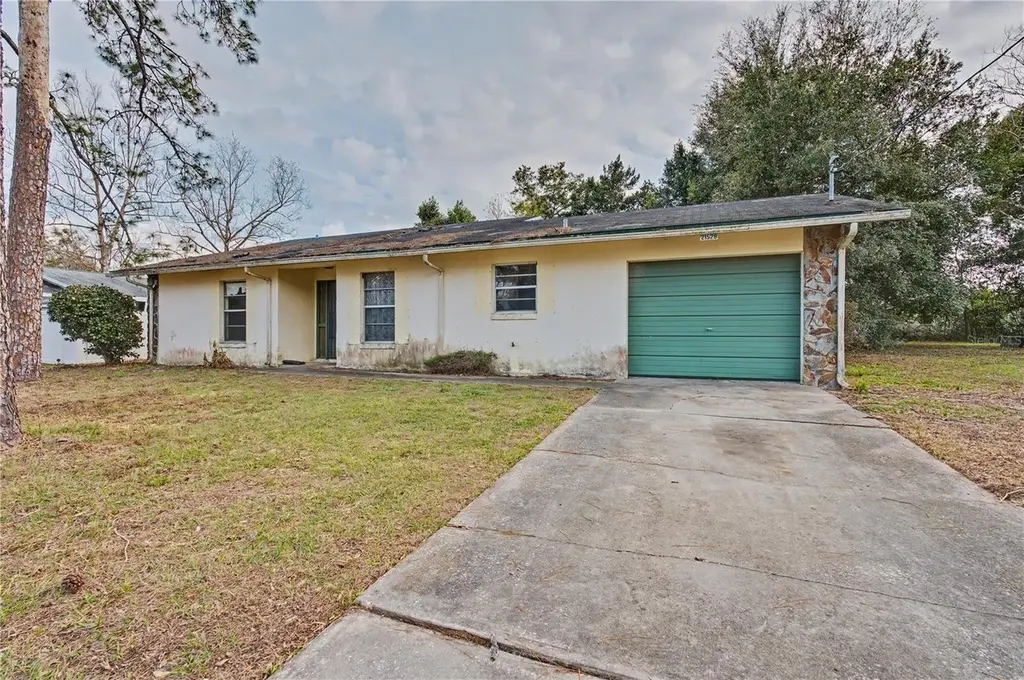
21528 SW Honeysuckle St
Rainbow Lakes Estates, FL 34431
$125,528B-
2 bd · 2.0 ba ·
1,398 sqft ·
Built 1982
· SingleFamily
· Pending
· 79 DOM
Cashflow @ list (25.0% down · 7.5%)
Estimated rent
$1,645/mo
Mortgage (P&I)
−$658
Tax + insurance
−$383
HOA
−$0
Vac / Maint / Mgmt
−$346
Net cashflow
$259/mo
Annual
$3,104/yr
Cap rate
8.77%
Cash-on-cash
8.83%
DSCR
1.39
1% rule
1.31%
Cash to close
$35,148
Investor read
- This is a 2-bed/2.0-bath single-family listed at $126k.
- At list price, monthly cash flow is $259 ($3k/yr) — positive.
- The deal already cash-flows at list — no discount required.
- Meets the 1% rule at list price ($2k rent vs $126k).
- It's been on market 79 days — a 6% lower offer ($118k) is reasonable based on typical stale-listing flexibility.
- Recommended offer: $118k (6.0% below list) — sets the bar for market timing.
- Local home prices are declining (-3.0%/yr); year-one equity from $868 of loan paydown is wiped out by about $4k of value loss. Plan a longer hold.
- Location reads: area grade B — affects rentability + tenant quality, not the cash-flow math above.
- Marion (rural): math 42% / reading 43% proficiency, ranked #61 of 73 in FL (top 84%) — families likely to look elsewhere, expect single-tenant / working-renter base with shorter leases; 61% free/reduced lunch — lower-income household profile, screen leases tightly.
- Watch-outs: property tax is 3.2% of price.
- Market conditions: 553 active listings in the ZIP; 3 comparable units currently listed for rent nearby; rentals leasing fast (median 14d on market — plan ~1-2 weeks tenant-placement turnaround); 7,071 units permitted in Marion County in 2024 (534 in 5+ unit buildings).
- Marion County population projected at +13% by 2050 — modest demand growth; plan on rents tracking national, not racing it.
- Current owner paid $48k; list at $126k implies a 161% gain — meaningful room to come down on a strong offer.
- Climate carrying-cost: severe wind risk, 99% chance of damaging wind over 30y — expect insurance premiums to compound above CPI over the hold.
- Cap rate 8.8% vs local median 4.5% in Rainbow Lakes Estates — top-decile yield for the area; either an underpriced asset or a hidden risk that comps aren't pricing in. Stress-test before assuming the spread holds.
- This rent runs 35% of the median local income ($57k/yr) — at the standard rent-burdened threshold; future hikes will face affordability resistance.
Questions for listing agent
- It's been on market 79 days. Have you received any prior offers? Is the seller open to a 6% concession, seller financing, or rate buy-down credit?
- Property tax is high relative to price — has the assessment been appealed recently, and will the sale trigger a re-assessment?
- Why hasn't it sold? Are there any deal-killer items the seller is aware of (foundation, flood, title, zoning, code violations)?
- Is there a deadline driving the sale (1031 exchange, divorce, estate, relocation)? That informs how much negotiation room exists.
- What's the average days-on-market for RENTAL listings here right now (not sales)? A rising rental-DOM trend means longer vacancies and softer asking-rent achievability than the comps imply.
- What's the recent tenant-quality profile in this submarket — average credit score on applications, eviction rate, late-payment / NSF rate, and stable-employment percentage? A property-management company in the area should have these aggregated.
- How much new for-sale + rental construction is in the pipeline within 1–3 miles? Heavy new supply typically softens prices + rents 12–24 months out; constrained supply supports both.
CashFlowRE · CFR-0YMS7B7064K328
· Data 3 weeks ago
cashflowre.app · 2026-05-29