 🏷️ Likely Rental
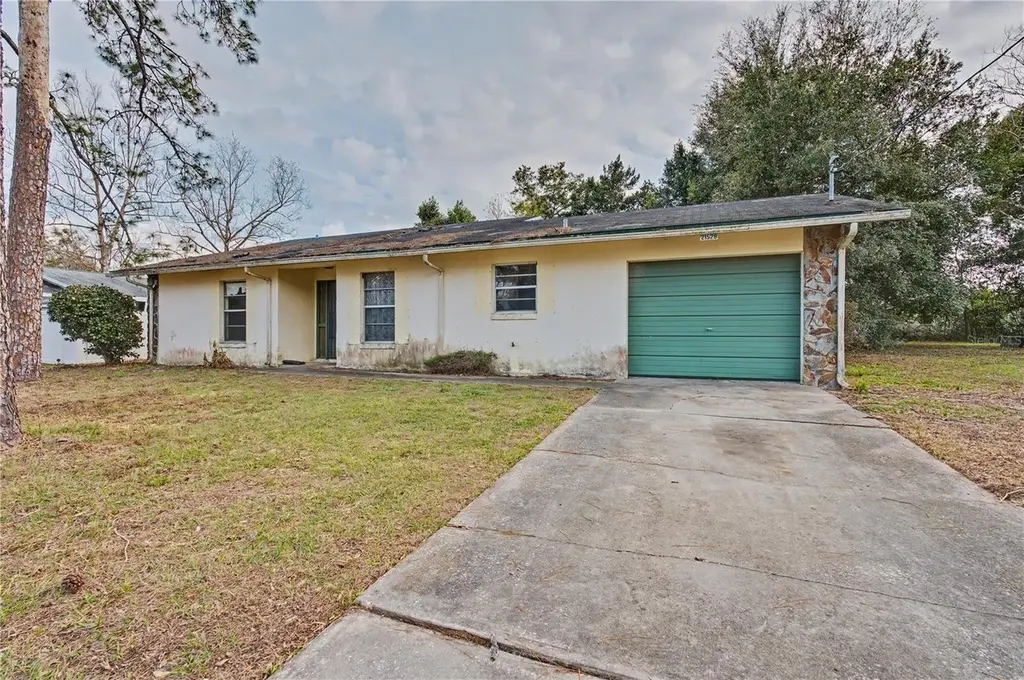
21528 SW Honeysuckle St · Rainbow Lakes Estates, FL
Flood risk 1/10 · Minimal
- FEMA flood zone
- X (unshaded)
- Chance of flooding over 30 yrs
- 0.0%
- Est. flood insurance / yr
- $507 – $1,088
Fire risk 4/10 · Minor
- Est. fire insurance / yr
- $947 – $1,759
Heat risk No data
- Hot days now (above threshold)
- —
- Hot days in 30 yrs
- —
Wind risk 9/10 · Severe
- Chance of severe wind over 30 yrs
- 99.0%
Air-quality risk 2/10 · Minimal
- Unhealthy air days now
- 0 days/yr
- Unhealthy air days in 30 yrs
- 1 days/yr
Risk factors via First Street. Map © Google.
Why this score? — see what drove the B- grade
The composite is a weighted blend of 9 inputs, each scored 0–100. Each bar is that input's sub-score; the figure is the points it added to the 100-point composite (weight × sub-score).
- Cash flow +24.6/30.0
- ARV discount +15.0/15.0
- 1% rule +8.1/10.0
- DSCR +7.9/10.0
- Schools +3.6/10.0
- Rent growth +2.5/5.0
- Livability +2.5/5.0
- Condition / age +2.5/5.0
- Appreciation +0.0/10.0
$125,528
🖨 Deal sheet 📄 Offer letter ✓ Due diligence
Listing remarks MLS
INVESTOR SPECIAL – CASH OR HARD MONEY ONLY! Opportunity is calling in the desirable 34431 area with this 2-bedroom, 2-bath block home primed for its next transformation. Featuring solid construction and strong foundational integrity, this property presents the ideal value-add scenario for investors seeking to renovate and capitalize on upside potential. The functional layout offers flexibility for a profitable flip or long-term rental strategy. A generously sized backyard further enhances the asset, creating options for outdoor living enhancements, added amenities, or increased tenant appeal. This is the type of opportunity that delivers real equity growth—don’t miss your chance to secure it.
Key facts
- Solid construction
- Functional layout
- 0.24 acre lot
Tags
Neighborhood map
What this means for you Summary
Snapshot
- This is a 2-bed/2.0-bath single-family listed at $126k.
Deal economics
- At list price, monthly cash flow is $259 ($3k/yr) — positive.
- The deal already cash-flows at list — no discount required.
- Meets the 1% rule at list price ($2k rent vs $126k).
- Recommended offer: $118k (6.0% below list) — sets the bar for market timing.
- Cap rate 8.8% vs local median 4.5% in Rainbow Lakes Estates — top-decile yield for the area; either an underpriced asset or a hidden risk that comps aren't pricing in. Stress-test before assuming the spread holds.
Location & tenants
- Location reads: area grade B — affects rentability + tenant quality, not the cash-flow math above.
- Marion (rural): math 42% / reading 43% proficiency, ranked #61 of 73 in FL (top 84%) — families likely to look elsewhere, expect single-tenant / working-renter base with shorter leases; 61% free/reduced lunch — lower-income household profile, screen leases tightly.
- Market conditions: 553 active listings in the ZIP; 3 comparable units currently listed for rent nearby; rentals leasing fast (median 13d on market — plan ~1-2 weeks tenant-placement turnaround); 7,071 units permitted in Marion County in 2024 (534 in 5+ unit buildings).
- This rent runs 35% of the median local income ($57k/yr) — at the standard rent-burdened threshold; future hikes will face affordability resistance.
Forward outlook
- Local home prices are declining (-3.0%/yr); year-one equity from $868 of loan paydown is wiped out by about $4k of value loss. Plan a longer hold.
- Marion County population projected at +13% by 2050 — modest demand growth; plan on rents tracking national, not racing it.
Negotiation context
- It's been on market 79 days — a 6% lower offer ($118k) is reasonable based on typical stale-listing flexibility.
- Current owner paid $48k; list at $126k implies a 161% gain — meaningful room to come down on a strong offer.
Risks & watch-outs
- Watch-outs: property tax is 3.2% of price.
- Climate carrying-cost: severe wind risk, 99% chance of damaging wind over 30y — expect insurance premiums to compound above CPI over the hold.
Questions for the listing agent
- It's been on market 79 days. Have you received any prior offers? Is the seller open to a 6% concession, seller financing, or rate buy-down credit?
- Property tax is high relative to price — has the assessment been appealed recently, and will the sale trigger a re-assessment?
- Why hasn't it sold? Are there any deal-killer items the seller is aware of (foundation, flood, title, zoning, code violations)?
- Is there a deadline driving the sale (1031 exchange, divorce, estate, relocation)? That informs how much negotiation room exists.
- What's the average days-on-market for RENTAL listings here right now (not sales)? A rising rental-DOM trend means longer vacancies and softer asking-rent achievability than the comps imply.
- What's the recent tenant-quality profile in this submarket — average credit score on applications, eviction rate, late-payment / NSF rate, and stable-employment percentage? A property-management company in the area should have these aggregated.
- How much new for-sale + rental construction is in the pipeline within 1–3 miles? Heavy new supply typically softens prices + rents 12–24 months out; constrained supply supports both.
Investment metrics
- 1% rule
- 1.31% ✓
- Cap rate
- 8.77%
- Cash-on-cash
- 8.83%
- DSCR
- 1.39
- GRM
- 6.4
CMA / ARV
- ARV (median comp)
- $222,004
- List price
- $125,528
- Delta
- -43.46%
- Verdict
- UNDERPRICED
- Comps
- 20 within 1.0 mi
Show comp detail 11 sales within ~0.75 mi
| Address | Dist | Beds/Ba | Sqft | Sold | Price | $/sf | Match |
|---|---|---|---|---|---|---|---|
| 21474 SW Peach Blossom St | 0.14mi | 3/2.0 (+1) | 1,411 (+1%) | 2mo | $275,000 | $195 | 85 |
| 21428 SW Raintree St | 0.12mi | 3/2.0 (+1) | 1,461 (+4%) | 9mo | $199,000 | $136 | 75 |
| 21110 SW Plantation St | 0.42mi | 3/2.0 (+1) | 1,470 (+5%) | 4mo | $199,000 | $135 | 64 |
| 21988 SW Mango Ln | 0.55mi | 3/2.0 (+1) | 1,331 (-5%) | 1mo | $249,900 | $188 | 61 |
| 22285 SW Anchor Blvd | 0.57mi | 3/2.0 (+1) | 1,380 (-1%) | 6mo | $248,900 | $180 | 61 |
| 22334 SW Edgewater Blvd | 0.31mi | 3/2.0 (+1) | 1,331 (-5%) | 15mo | $239,900 | $180 | 60 |
| 4430 SW Floral Ct | 0.65mi | 3/2.0 (+1) | 1,380 (-1%) | 5mo | $248,900 | $180 | 59 |
| 21641 SW Marine Blvd | 0.21mi | 3/2.0 (+1) | 1,576 (+13%) | 7mo | $259,900 | $165 | 58 |
| 21368 SW Peach Blossom St | 0.20mi | 3/2.0 (+1) | 1,204 (-14%) | 8mo | $165,000 | $137 | 56 |
| 21682 SW Peach Blossom St | 0.20mi | 2/2.0 | 1,216 (-13%) | 19mo | $193,500 | $159 | 53 |
| 4152 SW Begonia Ct | 0.50mi | 3/2.0 (+1) | 1,600 (+14%) | 4mo | $315,000 | $197 | 44 |
Match score weights: distance 35% · size 25% · config 20% · recency 20%. Top-matched comps best support the ARV.
Projected returns pro-forma
-3.0% appreciation · 3.0% rent growth · sell at horizon
- IRR
- -2.8%
- Equity multiple
- 0.89×
- Total profit
- $-3,735
- Equity at exit
- $18,717
- IRR
- 7.0%
- Equity multiple
- 1.53×
- Total profit
- $18,495
- Equity at exit
- $10,853
Cash invested: $35,148 (down + closing). Projections, not guarantees.
Landlord ↔ Tenant lean methodology
- Overall (STATE)
- 87 Strongly Landlord-Friendly
- State Florida
- 87 Strongly Landlord-Friendly · R+3
- County
- — inherits STATE
- City
- — inherits STATE
ZIP-level market 34431
- Home prices YoY
- -3.2%
- Active inventory
- 553
- Price-to-rent
- 6.4×
Monthly cashflow live
- Estimated rent
- $1,645 medium interval (Pro) →
- Mortgage (P&I)
- −$658
- Tax from tax record
- −$331 /mo · $3,967/yr
- Insurance
- −$52
- HOA
- −$0
- Vacancy / Maint / Mgmt
- −$346
- Net cashflow
- $259
Break-even live
UW: 25.0% down · 7.5% · 30yr · 1.5% tax · 5.0% vac · 8.0% maint · 8.0% mgmt
Financing live
Cash to close
- Down payment
- $31,382
- Closing costs
- $3,766
- Reserves months
- —
- Total cash needed
- —
Loan-product check · same deal, 3 products live
Conventional
25% down · 7.5% · 30yr
- Down + closing
- —
- Monthly P&I
- —
- Monthly cashflow
- —
- DSCR
- —
- Eligible?
- —
Personal DTI + credit; lowest rate.
DSCR
20% down · 8.5% · 30yr
- Down + closing
- —
- Monthly P&I
- —
- Monthly cashflow
- —
- DSCR
- —
- Eligible?
- —
No personal income docs; deal must DSCR.
Hard money
10% down · 12.0% · 12mo
- Down + closing
- —
- Monthly P&I
- —
- Monthly cashflow
- —
- DSCR
- —
- Eligible?
- —
Short-term bridge; refi at stabilization.
Rent comps 3 comps
| Address | Beds | Baths | Sqft | Rent | $/sqft | DOM | Units | Dist |
|---|---|---|---|---|---|---|---|---|
| 21425 SW Plantation St Dunnellon, FL | 3.0 | 2.0 | 1456 | $1,800 | $1.24 | 13d | 1 | 0.14mi |
| 21423 SW Beach Blvd Dunnellon, FL | 3.0 | 2.0 | 1066 | $1,400 | $1.31 | 13d | 1 | 0.31mi |
| 22222 SW Marine Blvd Dunnellon, FL | 3.0 | 2.0 | 1473 | $1,799 | $1.22 | 13d | 1 | 0.74mi |
Listing history 4 events
-
2026-05-04price $125,528 719-char remark
Show marketing remark (719 chars)
INVESTOR SPECIAL – CASH OR HARD MONEY ONLY! Opportunity is calling in the desirable 34431 area with this 2-bedroom, 2-bath block home primed for its next transformation. Featuring solid construction and strong foundational integrity, this property presents the ideal value-add scenario for investors seeking to renovate and capitalize on upside potential. The functional layout offers flexibility for a profitable flip or long-term rental strategy. A generously sized backyard further enhances the asset, creating options for outdoor living enhancements, added amenities, or increased tenant appeal. This is the type of opportunity that delivers real equity growth—don’t miss your chance to secure it.
-
2026-04-01price $130,528 719-char remark
Show marketing remark (719 chars)
INVESTOR SPECIAL – CASH OR HARD MONEY ONLY! Opportunity is calling in the desirable 34431 area with this 2-bedroom, 2-bath block home primed for its next transformation. Featuring solid construction and strong foundational integrity, this property presents the ideal value-add scenario for investors seeking to renovate and capitalize on upside potential. The functional layout offers flexibility for a profitable flip or long-term rental strategy. A generously sized backyard further enhances the asset, creating options for outdoor living enhancements, added amenities, or increased tenant appeal. This is the type of opportunity that delivers real equity growth—don’t miss your chance to secure it.
-
2026-03-03$135,000 Active 719-char remark
Show marketing remark (719 chars)
INVESTOR SPECIAL – CASH OR HARD MONEY ONLY! Opportunity is calling in the desirable 34431 area with this 2-bedroom, 2-bath block home primed for its next transformation. Featuring solid construction and strong foundational integrity, this property presents the ideal value-add scenario for investors seeking to renovate and capitalize on upside potential. The functional layout offers flexibility for a profitable flip or long-term rental strategy. A generously sized backyard further enhances the asset, creating options for outdoor living enhancements, added amenities, or increased tenant appeal. This is the type of opportunity that delivers real equity growth—don’t miss your chance to secure it.
-
1982-03-01soldstatus $48,065
ⓘ Source: listings_history table (triggers on properties + properties_extension) + one-shot
backfill from property_details.listing_events for pre-trigger history.
Tax reassessment forecast FL · Resets to sale price
- Current annual tax
- $3,967 · $331/mo
- Projected year-2 tax
- $3,967 · $331/mo
- Expected delta
- $0/yr ($0/mo · 0.0%)
ⓘ Screening estimate from a state-policy table — verify with the county assessor before closing.
Climate risk First Street
- Flood 1/10 Low FEMA zone X (unshaded) · 0% chance over 30 yrs
- Wildfire 4/10 Moderate
- Wind 9/10 Extreme 99% chance of damaging wind over 30 yrs
- Air quality 2/10 Low 0 unhealthy d/yr today · 1 by 30 yrs out
Nearby sold comps map
Loading sold comps map…
Walkable amenities ~0.75 mi
Loading nearby amenities…
Taxation est. · year 1
- Rental income
- $19,744
- − Mortgage interest
- −$7,032
- − Property taxes
- −$3,967
- − Insurance
- −$628
- − Repairs & maintenance
- −$1,580
- − Management
- −$1,580
- − Depreciation
- −$3,652
- Taxable income
- $1,307
- Est. tax owed @ 24.0%
- −$314
- After-tax cash flow
- $2,790/yr
For passive investors: Depreciation is non-cash, so a rental often shows a tax loss while cash-flowing — sheltering income. Rental losses are passive: they offset passive income freely, and up to $25,000/yr can offset ordinary (W-2) income if you actively participate and your MAGI is under $100k (phasing out to $0 by $150k); unused losses carry forward. On sale, claimed depreciation is recaptured at up to 25%, and gains may owe capital-gains tax (a 1031 exchange can defer both). Figures are a year-1 estimate at your 24.0% rate — not tax advice; consult a CPA.
Schools (NCES district)
- District
- Marion
- NCES district ID
- 1201260
- Math proficiency
- 42% ▼ -7.00%
- Reading proficiency
- 43% ▼ -4.00%
- Median HH income
- $40,015
- Composite
- 35.61/100
- National rank
- #4890
- State rank
- #61 of 73 in FL
Livability — Rainbow Lakes Estates
No livability data for this city. (Only ~50 U.S. cities are tracked.)
Census & demographics
- Census place
- Rainbow Lakes Estates, FL
- County
- Marion County · 315,796 people
- Metro
- Ocala, FL
- Population (ZIP)
- 9,785
- Household income
- $56,534
- Rent vs Own
- Severe rent burden
- 72.0
Population outlook (Marion County) Hauer SSP2
- Today (2025)
- 365,905 people
- By 2030
- 376,768 · +3.0%
- By 2040
- 396,555 · +8.4%
- By 2050
- 412,723 · +12.8%
- By 2075
- 446,090 · +21.9%
- By 2100
- 436,193 · +19.2%
Race, ethnicity, and origin ACS 2023
- Neighborhood character
- Predominantly White (87%)
- Race & ethnicity
- White 87% Hispanic / Latino 7% Two or more races 5% Black 3% Asian 1%
- Hispanic origin (detail)
- Mexican 2% Puerto Rican 4% Cuban 1%
- Common ancestry
- Lithuanian 4% Slovak 3% Portuguese 2%
- Foreign-born
- 4% · Canada, Vietnam
- Languages at home
- 96% English-only · Spanish 2% German/W. Germanic 1% Vietnamese 1%
Political lean MEDSL · Marion
- 2024 margin
- Solid R (+31.6) · D 33.8% · R 65.5%
- 2008→2024 swing
- -20.0pp toward R · 2008: -11.6pp · 2024: -31.6pp
- All cycles
- 2024: R+31.6 2020: R+25.9 2016: R+26.2 2012: R+16.2 2008: R+11.6
Not yet ingested
- Civics
- —
Market trends
- HPI YoY
- ▼ -11.42%
- Current HPI
- 343.1464
- Rent YoY
- —
- Metro
- Ocala, FL
- State GDP YoY
- ▲ 3.28%
- F500 in state
- 36
Industry mix (Fortune 500 HQ in FL)
| Industry | F500 HQs | Revenue |
|---|---|---|
| Industrial Technology | 2 | $29B |
|
||
| Insurance | 2 | $17B |
|
||
| Retail | 1 | $60B |
|
||
| Technology Distribution | 1 | $58B |
|
||
| Homebuilding | 1 | $35B |
|
||
| Technology Manufacturing | 1 | $35B |
|
||
Price history
+161.2% since first listed4 events — show timeline
- 2026-05-04 Price Changed $125,528 Stellar MLS as Distributed by MLS Grid
- 2026-04-01 Price Changed $130,528 Stellar MLS as Distributed by MLS Grid
- 2026-03-03 Listed $135,000 Stellar MLS as Distributed by MLS Grid
- 1982-03-01 Sold (Public Records) $48,065 Public Records
Property tax history
+18.9%/yrLatest (2025): $3,967 · +398.4% YoY. Source: county tax records.
Cash-flow waterfall
monthlySold comps — $/sqft
last 12 mo · ≤1 miLoading sold comps…