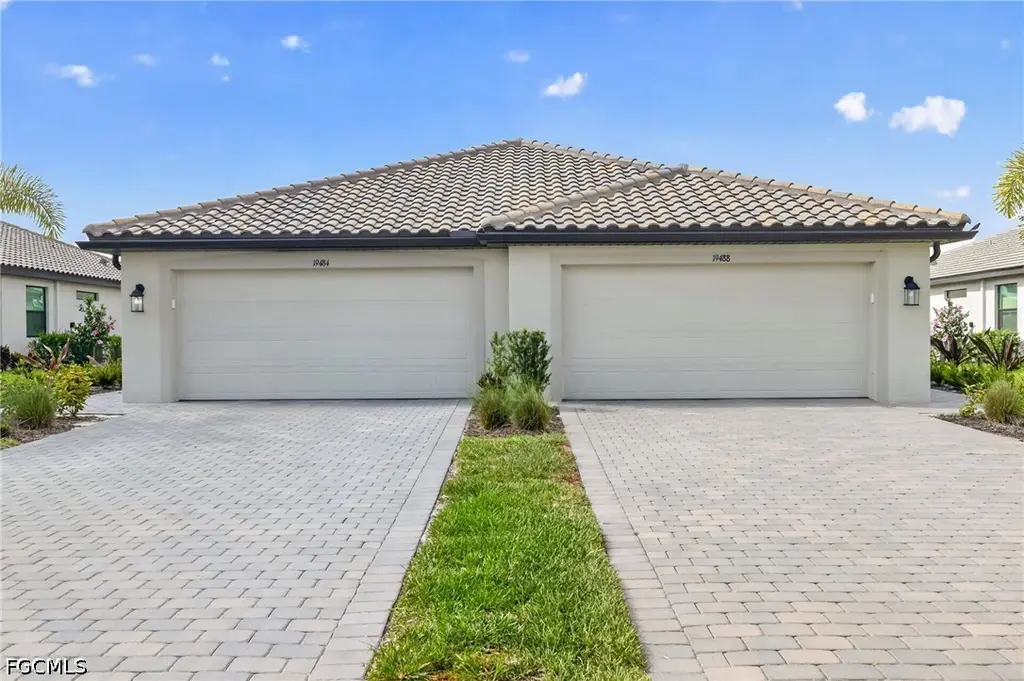
19488 Hinkley Dr
Lehigh Acres, FL 33928
$369,000B-
2 bd · 2.0 ba ·
1,564 sqft ·
Built 2024
· Condo
· Pending
· 21 DOM
Cashflow @ list (25.0% down · 7.5%)
Estimated rent
$5,209/mo
Mortgage (P&I)
−$1,935
Tax + insurance
−$644
HOA
−$342
Vac / Maint / Mgmt
−$1,094
Net cashflow
$1,195/mo
Annual
$14,336/yr
Cap rate
10.18%
Cash-on-cash
13.88%
DSCR
1.62
1% rule
1.41%
Cash to close
$103,320
Investor read
- This is a 2-bed/2.0-bath condo listed at $369k. Condition is rated good.
- At list price, monthly cash flow is $1k ($14k/yr) — positive.
- The deal already cash-flows at list — no discount required.
- Meets the 1% rule at list price ($5k rent vs $369k).
- It's been on market 21 days — a 2% lower offer ($363k) is reasonable based on typical stale-listing flexibility.
- Recommended offer: $363k (1.5% below list) — sets the bar for market timing.
- Local home prices are declining (-3.0%/yr); year-one equity from $3k of loan paydown is wiped out by about $11k of value loss. Plan a longer hold.
- Location reads 59/100 on livability (#826 in FL) — a working-class tenant base; expect higher turnover. Strengths: cost of living A+, housing A+; Watch: crime C-, employment D+, amenities F.
- Lee (suburban): math 47% / reading 50% proficiency, ranked #42 of 73 in FL (top 58%) — families likely to look elsewhere, expect single-tenant / working-renter base with shorter leases.
- Zoned schools: Pinewoods Elementary School (math 81% / reading 74%, grade A, #163 of 2,144 statewide, top 8%, 1,089 students, 25% FRL); Lexington Middle School (math 55% / reading 54%, grade B-, #183 of 571 statewide, top 34%, 1,138 students, 44% FRL); South Fort Myers High School (math 23% / reading 30%, grade F, #489 of 667 statewide, top 74%, 1,917 students, 50% FRL) — zoned schools average 39% FRL vs 57% district-wide (18 pts lower); this property's tenant base skews higher-income than the district average.
- Market conditions: Rents soft (-1.4%/yr); 674 active listings in the ZIP; 13 comparable units currently listed for rent nearby; rentals at typical pace (median 26d on market — plan ~3-4 weeks tenant-placement turnaround); solid renter incomes; 15,411 units permitted in Lee County in 2024 (4,686 in 5+ unit buildings).
- Lee County population projected at +44% by 2050 — long-run rental-demand tailwind backs the buy-and-hold thesis.
- Cap rate 10.2% vs local median 4.7% in Lehigh Acres — top-decile yield for the area; either an underpriced asset or a hidden risk that comps aren't pricing in. Stress-test before assuming the spread holds.
- At $5,209/mo this rent would consume 61% of the median local household income ($103k/yr) (locally 606% of renters already pay >50% of income on rent) — very limited rent-growth headroom before tenants either downsize or default.
Questions for listing agent
- What does the HOA fee cover, when was the last increase, and are there any pending special assessments or reserve-fund shortfalls?
- Any open or pending special assessments — roof, HVAC, plumbing, elevator, façade? What's the per-unit balance and payoff schedule, and is the seller paying it off at close or rolling it to the buyer?
- Is there a deadline driving the sale (1031 exchange, divorce, estate, relocation)? That informs how much negotiation room exists.
- Schools are D-rated, which usually means shorter tenancies and higher turnover. Who's the typical renter profile here, and what's been the actual vacancy rate?
- What's the average days-on-market for RENTAL listings here right now (not sales)? A rising rental-DOM trend means longer vacancies and softer asking-rent achievability than the comps imply.
- What's the recent tenant-quality profile in this submarket — average credit score on applications, eviction rate, late-payment / NSF rate, and stable-employment percentage? A property-management company in the area should have these aggregated.
- How much new apartment / multifamily construction is in the pipeline within 1–3 miles? Heavy new supply (>2% of stock underway) typically softens rents 12–24 months out; light construction supports rent growth.
CashFlowRE · CFR-0YX31P997X6JXX
· Data 1 week ago
cashflowre.app · 2026-05-29