19488 Hinkley Dr · Lehigh Acres, FL
Flood risk No data
- FEMA flood zone
- —
- Chance of flooding over 30 yrs
- —
- Est. flood insurance / yr
- —
Fire risk No data
- Est. fire insurance / yr
- —
Heat risk No data
- Hot days now (above threshold)
- —
- Hot days in 30 yrs
- —
Wind risk No data
- Chance of severe wind over 30 yrs
- —
Air-quality risk No data
- Unhealthy air days now
- —
- Unhealthy air days in 30 yrs
- —
Risk factors via First Street. Map © Google.
Why this score? — see what drove the B- grade
The composite is a weighted blend of 9 inputs, each scored 0–100. Each bar is that input's sub-score; the figure is the points it added to the 100-point composite (weight × sub-score).
- Cash flow +28.4/30.0
- DSCR +10.0/10.0
- 1% rule +9.1/10.0
- ARV discount +7.5/15.0
- Schools +4.1/10.0
- Condition / age +4.0/5.0
- Livability +3.0/5.0
- Rent growth +2.1/5.0
- Appreciation +0.0/10.0
$369,000
🖨 Deal sheet (PDF) 📄 Offer letter ✓ Due diligence
Listing remarks
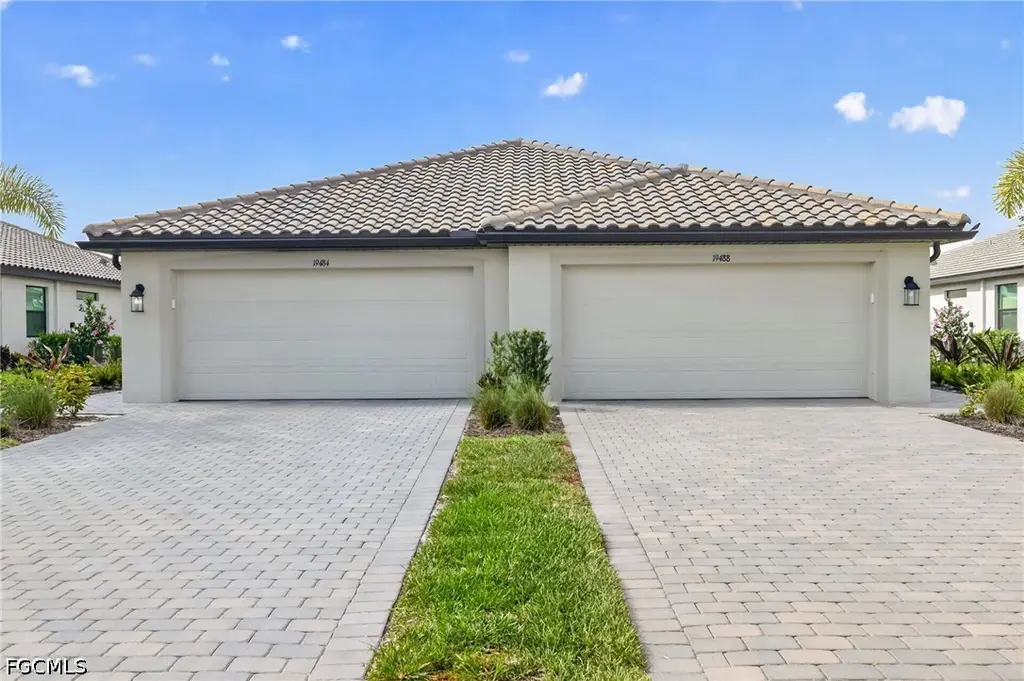
Welcome to 19488 Hinkley Drive in Verdana Village, a dynamic, amenity-rich community designed for an active Southwest Florida lifestyle. This Orchid floor plan offers 2 bedrooms, 2 bathrooms, and a 2-car garage across 1,564 square feet of thoughtfully designed single-level living. Inside, the open-concept layout features a seamless flow between the kitchen, dining, and living areas, all opening to a private lanai. Impact-resistant windows and doors provide added security, and the home is located in a non-flood zone. The owner’s suite is privately situated at the rear, while the front of the home includes a guest bedroom, full bath, and a flexible den—perfect for a home office, w
Key facts
- Pickleball courts
- Non flood zone
- Tennis courts
Tags
Property features AI
Finance
- Other: Private paved road with private maintenance; Lot is rectangular with dimensions approximately 36 x 150 x 38 x 150 and southern exposure
- Financial info: Pets allowed: call/conditional
- HOA & community: Homeowners association with quarterly fees; Association covers management, irrigation water, grounds maintenance and street lights; Community amenities include clubhouse, fitness center, pool, tennis, pickleball, bocce, basketball, dog park, trails, sidewalks and on-site management; Gated community with street lights
Exterior
- Parking: Attached 2-car garage; Driveway; Paved parking; Garage door opener; 2 covered spaces
- Security: Gated community with guard; Smoke detector(s)
- Utilities: Public water; Public sewer; Cable available; Natural gas available; High-speed internet available; Underground utilities
- Home design: Single-story home; Tile roof; Block, concrete and stucco construction; North-facing entry; Entry at level 1; Has a view; Resale property; MPD zoning
- Construction: Built with block, concrete and stucco; Tile roof
- Exterior features: Security/high impact doors; Sprinkler/irrigation system (reclaimed water); Lanai; Screened porch; Porch; Guest house attached; Gated with guard; Smoke detectors; Community pool
Interior
- Kitchen: Gas cooktop; Dishwasher; Disposal; Freezer; Refrigerator with icemaker; Icemaker
- Bedrooms: Bedroom on main level; Guest quarters (additional attached guest house)
- Flooring: Tile
- Bathrooms: 2 full bathrooms; Separate shower
- Heating & cooling: Gas heating; Gas cooling; Ceiling fans
- Interior features: Impact glass windows; French doors; Breakfast bar; Kitchen island; Living/dining room; Pantry; Separate shower (shower only); Walk-in closets; High-speed internet; Home office; Split bedroom layout; Unfurnished
- Laundry & utility: Washer; Dryer; Tankless water heater
Neighborhood map
What this means for you Summary
Snapshot
- This is a 2-bed/2.0-bath condo listed at $369k. Condition is rated good.
Deal economics
- At list price, monthly cash flow is $1k ($14k/yr) — positive.
- The deal already cash-flows at list — no discount required.
- Meets the 1% rule at list price ($5k rent vs $369k).
- Recommended offer: $363k (1.5% below list) — sets the bar for market timing.
- Cap rate 10.2% vs local median 4.7% in Lehigh Acres — top-decile yield for the area; either an underpriced asset or a hidden risk that comps aren't pricing in. Stress-test before assuming the spread holds.
Location & tenants
- Location reads 59/100 on livability (#826 in FL) — a working-class tenant base; expect higher turnover. Strengths: cost of living A+, housing A+; Watch: crime C-, employment D+, amenities F.
- Lee (suburban): math 47% / reading 50% proficiency, ranked #42 of 73 in FL (top 58%) — families likely to look elsewhere, expect single-tenant / working-renter base with shorter leases.
- Zoned schools: Pinewoods Elementary School (math 81% / reading 74%, grade A, #163 of 2,144 statewide, top 8%, 1,089 students, 25% FRL); Lexington Middle School (math 55% / reading 54%, grade B-, #183 of 571 statewide, top 34%, 1,138 students, 44% FRL); South Fort Myers High School (math 23% / reading 30%, grade F, #489 of 667 statewide, top 74%, 1,917 students, 50% FRL) — zoned schools average 39% FRL vs 57% district-wide (18 pts lower); this property's tenant base skews higher-income than the district average.
- Market conditions: Rents soft (-1.4%/yr); 674 active listings in the ZIP; 13 comparable units currently listed for rent nearby; rentals at typical pace (median 25d on market — plan ~3-4 weeks tenant-placement turnaround); solid renter incomes; 15,411 units permitted in Lee County in 2024 (4,686 in 5+ unit buildings).
- At $5,209/mo this rent would consume 61% of the median local household income ($103k/yr) (locally 606% of renters already pay >50% of income on rent) — very limited rent-growth headroom before tenants either downsize or default.
Forward outlook
- Local home prices are declining (-3.0%/yr); year-one equity from $3k of loan paydown is wiped out by about $11k of value loss. Plan a longer hold.
- Lee County population projected at +44% by 2050 — long-run rental-demand tailwind backs the buy-and-hold thesis.
Negotiation context
- It's been on market 21 days — a 2% lower offer ($363k) is reasonable based on typical stale-listing flexibility.
Questions for the listing agent
- What does the HOA fee cover, when was the last increase, and are there any pending special assessments or reserve-fund shortfalls?
- Any open or pending special assessments — roof, HVAC, plumbing, elevator, façade? What's the per-unit balance and payoff schedule, and is the seller paying it off at close or rolling it to the buyer?
- Is there a deadline driving the sale (1031 exchange, divorce, estate, relocation)? That informs how much negotiation room exists.
- Schools are D-rated, which usually means shorter tenancies and higher turnover. Who's the typical renter profile here, and what's been the actual vacancy rate?
- What's the average days-on-market for RENTAL listings here right now (not sales)? A rising rental-DOM trend means longer vacancies and softer asking-rent achievability than the comps imply.
- What's the recent tenant-quality profile in this submarket — average credit score on applications, eviction rate, late-payment / NSF rate, and stable-employment percentage? A property-management company in the area should have these aggregated.
- How much new apartment / multifamily construction is in the pipeline within 1–3 miles? Heavy new supply (>2% of stock underway) typically softens rents 12–24 months out; light construction supports rent growth.
Investment metrics
- 1% rule
- 1.41% ✓
- Cap rate
- 10.18%
- Cash-on-cash
- 13.88%
- DSCR
- 1.62
- GRM
- 5.9
CMA / ARV
No comps found within radius.
Projected returns pro-forma
-3.0% appreciation · 0.0% rent growth · sell at horizon
- IRR
- 0.4%
- Equity multiple
- 1.01×
- Total profit
- $1,333
- Equity at exit
- $55,019
- IRR
- 6.3%
- Equity multiple
- 1.40×
- Total profit
- $41,381
- Equity at exit
- $31,904
Cash invested: $103,320 (down + closing). Projections, not guarantees.
Landlord ↔ Tenant lean methodology
- Overall (STATE)
- 87 Strongly Landlord-Friendly
- State Florida
- 87 Strongly Landlord-Friendly · R+3
- County
- — inherits STATE
- City
- — inherits STATE
ZIP-level market 33928
- Rents YoY
- -1.4%
- Active inventory
- 674
- Price-to-rent
- 5.9×
Monthly cashflow live
- Estimated rent
- $5,209 high interval (Pro) →
- Mortgage (P&I)
- −$1,935
- Tax from tax record
- −$490 /mo · $5,879/yr
- Insurance
- −$154
- HOA
- −$342
- Vacancy / Maint / Mgmt
- −$1,094
- Net cashflow
- $1,195
Break-even live
Sensitivity live
| Price | -10% $1,404 | -5% $1,299 | +0% $1,195 | +5% $1,090 | +10% $986 |
|---|---|---|---|---|---|
| Rent | -10% $783 | -5% $989 | +0% $1,195 | +5% $1,400 | +10% $1,606 |
| Rate | -1.0pp $1,380 | -0.5pp $1,288 | base $1,195 | +0.5pp $1,099 | +1.0pp $1,002 |
UW: 25.0% down · 7.5% · 30yr · 1.5% tax · 5.0% vac · 8.0% maint · 8.0% mgmt
Financing live
Cash to close
- Down payment
- $92,250
- Closing costs
- $11,070
- Reserves months
- —
- Total cash needed
- —
Loan-product check · same deal, 3 products live
Conventional
25% down · 7.5% · 30yr
- Down + closing
- —
- Monthly P&I
- —
- Monthly cashflow
- —
- DSCR
- —
- Eligible?
- —
Personal DTI + credit; lowest rate.
DSCR
20% down · 8.5% · 30yr
- Down + closing
- —
- Monthly P&I
- —
- Monthly cashflow
- —
- DSCR
- —
- Eligible?
- —
No personal income docs; deal must DSCR.
Hard money
10% down · 12.0% · 12mo
- Down + closing
- —
- Monthly P&I
- —
- Monthly cashflow
- —
- DSCR
- —
- Eligible?
- —
Short-term bridge; refi at stabilization.
Rent comps 13 comps
| Address | Beds | Baths | Sqft | Rent | $/sqft | DOM | Units | Dist |
|---|---|---|---|---|---|---|---|---|
| 19218 Hinkley Dr Estero, FL | 3.0 | 2.0 | 1655 | $3,000 | $1.81 | 16d | 1 | 0.36mi |
| 19278 Hinkley Dr Estero, FL | 3.0 | 3.0 | 2201 | $3,395 | $1.54 | 4d | 1 | 0.43mi |
| 20285 Napa Loop Estero, FL | 3.0 | 3.0 | 2133 | $6,200 | $2.91 | 25d | 1 | 0.59mi |
| 19232 Gentry Pl Estero, FL | 3.0 | 3.0 | 2202 | $3,800 | $1.73 | 25d | 1 | 0.61mi |
| 20419 Pebble Glen Dr Estero, FL | 3.0 | 2.0 | 2088 | $6,490 | $3.11 | 25d | 1 | 0.65mi |
| 20047 Napa Loop Estero, FL | 3.0 | 3.0 | 2202 | $9,000 | $4.09 | 5d | 1 | 0.74mi |
| 20015 Napa Loop Estero, FL | 3.0 | 3.0 | 2202 | $8,000 | $3.63 | 25d | 1 | 0.82mi |
| 20024 Hartford Blvd Estero, FL | 3.0 | 2.0 | 2081 | $6,950 | $3.34 | 25d | 1 | 0.88mi |
| 18315 Ridgeline Dr Estero, FL | 3.0 | 3.0 | 2202 | $3,750 | $1.70 | 17d | 1 | 0.89mi |
| 20514 Pebble Glen Dr Estero, FL | 2.0 | 2.0 | 1670 | $5,700 | $3.41 | 25d | 1 | 0.91mi |
| 18282 Parksville Dr Estero, FL | 3.0 | 3.0 | 2126 | $10,000 | $4.70 | 25d | 1 | 0.93mi |
| 20530 Pebble Glen Dr Estero, FL | 3.0 | 3.0 | 2099 | $5,950 | $2.83 | 25d | 1 | 0.94mi |
| 19712 Deming Ln Estero, FL | 3.0 | 3.0 | 2091 | $8,500 | $4.07 | 23d | 1 | 1.33mi |
HOA detail condo
- Monthly dues
- $342 · $4,104/yr
- Likely covers
- security
- Assessments
- None detected in remarks — confirm with the listing agent.
Listing history 2 events
-
2026-05-13status Pending
-
2026-04-21$369,000 Active
ⓘ Source: listings_history table (triggers on properties + properties_extension) + one-shot
backfill from property_details.listing_events for pre-trigger history.
Tax reassessment forecast FL · Resets to sale price
- Current annual tax
- $5,879 · $490/mo
- Projected year-2 tax
- $5,879 · $490/mo
- Expected delta
- $0/yr ($0/mo · 0.0%)
ⓘ Screening estimate from a state-policy table — verify with the county assessor before closing.
Nearby sold comps map
Loading sold comps map…
Walkable amenities ~0.75 mi
Loading nearby amenities…
Taxation est. · year 1
- Rental income
- $62,512
- − Mortgage interest
- −$20,670
- − Property taxes
- −$5,879
- − Insurance
- −$1,845
- − Repairs & maintenance
- −$5,001
- − Management
- −$5,001
- − HOA
- −$4,104
- − Depreciation
- −$10,735
- Taxable income
- $9,278
- Est. tax owed @ 24.0%
- −$2,227
- After-tax cash flow
- $12,109/yr
For passive investors: Depreciation is non-cash, so a rental often shows a tax loss while cash-flowing — sheltering income. Rental losses are passive: they offset passive income freely, and up to $25,000/yr can offset ordinary (W-2) income if you actively participate and your MAGI is under $100k (phasing out to $0 by $150k); unused losses carry forward. On sale, claimed depreciation is recaptured at up to 25%, and gains may owe capital-gains tax (a 1031 exchange can defer both). Figures are a year-1 estimate at your 24.0% rate — not tax advice; consult a CPA.
Condition & rehab AI · 6 photos
This well-maintained, single-story home in Verdana Village offers a good condition with modern amenities and a good curb appeal. It is ready for a new owner to move in and enjoy the community amenities.
Value-add opportunities
- Both Painting exterior and interior walls — Fresh paint enhances curb appeal and interior aesthetics.
- Both Landscaping improvements — Enhances curb appeal and adds value to the property.
- Both New flooring in living and dining areas — Modern flooring improves aesthetics and adds value to the property.
Renovation cost estimate screening
Value-add ROI direction
- Both Painting exterior and interior walls — Fresh paint enhances curb appeal and interior aesthetics. ↑
- Both Landscaping improvements — Enhances curb appeal and adds value to the property. ↑
- Both New flooring in living and dining areas — Modern flooring improves aesthetics and adds value to the property. ↑
ⓘ Cost ranges are severity-bucket heuristics (US national rule-of-thumb). Get contractor quotes + a written scope before underwriting a rehab budget.
Schools (NCES district)
- District
- Lee
- NCES district ID
- 1201080
- Math proficiency
- 47% ▼ -11.00%
- Reading proficiency
- 50% ▼ -4.00%
- Median HH income
- $49,518
- Composite
- 41.49/100
- National rank
- #3458
- State rank
- #42 of 73 in FL
Livability — Lehigh Acres
- Score
- 59/100
- State rank
- #826
- US rank
- #20055
Category grades
Schools grade is shown separately in the Schools card above.
Census & demographics
- County
- Lee County · 788,662 people
- City population
- 130,638
- Metro
- Cape Coral-Fort Myers, FL
- Population (ZIP)
- 31,926
- Household income
- $102,624
- Rent vs Own
- Severe rent burden
- 606.0
Population outlook (Lee County) Hauer SSP2
- Today (2025)
- 871,946 people
- By 2030
- 955,468 · +9.6%
- By 2040
- 1,113,587 · +27.7%
- By 2050
- 1,256,891 · +44.1%
- By 2075
- 1,560,270 · +78.9%
- By 2100
- 1,726,848 · +98.0%
Race, ethnicity, and origin ACS 2023
- Neighborhood character
- Predominantly White (85%)
- Race & ethnicity
- White 85% Hispanic / Latino 8% Two or more races 7% Asian 3% Black 1%
- Hispanic origin (detail)
- Mexican 2% Puerto Rican 2% Cuban 1%
- Common ancestry
- Romanian 5% Lithuanian 3% Slovak 2%
- Foreign-born
- 11% · Canada, China, Jamaica
- Languages at home
- 90% English-only · Spanish 5% Other Indo-European 1% French/Haitian/Cajun 1%
Political lean MEDSL · Lee
- 2024 margin
- Strong R (+28.4) · D 35.5% · R 63.9%
- 2008→2024 swing
- -18.0pp toward R · 2008: -10.4pp · 2024: -28.4pp
- All cycles
- 2024: R+28.4 2020: R+19.2 2016: R+20.4 2012: R+16.6 2008: R+10.4
Not yet ingested
- Civics
- —
Market trends
- HPI YoY
- ▼ -109.49%
- Current HPI
- 197.5913
- Rent YoY
- ▼ -1.42%
- Metro
- Cape Coral-Fort Myers, FL
- State GDP YoY
- ▲ 3.28%
- F500 in state
- 36
Industry mix (Fortune 500 HQ in FL)
| Industry | F500 HQs | Revenue |
|---|---|---|
| Industrial Technology | 2 | $29B |
|
||
| Insurance | 2 | $17B |
|
||
| Retail | 1 | $60B |
|
||
| Technology Distribution | 1 | $58B |
|
||
| Homebuilding | 1 | $35B |
|
||
| Technology Manufacturing | 1 | $35B |
|
||
Price history
2 events — show timeline
- 2026-05-13 Pending — FORTMLS
- 2026-04-21 Listed $369,000 FORTMLS
Property tax history
+93.8%/yrLatest (2025): $5,879 · +93.8% YoY. Source: county tax records.
Cash-flow waterfall
monthlySold comps — $/sqft
last 12 mo · ≤1 miLoading sold comps…