9850 Garfield
Huntington Beach, CA 92646
$289,000B-
3 bd · 2.0 ba ·
1,560 sqft ·
Built 2003
· Manufactured
· Active
· 6 DOM
Cashflow @ list (25.0% down · 7.5%)
Estimated rent
$4,388/mo
Mortgage (P&I)
−$1,516
Tax + insurance
−$482
HOA
−$0
Vac / Maint / Mgmt
−$921
Net cashflow
$1,469/mo
Annual
$17,627/yr
Cap rate
12.39%
Cash-on-cash
21.78%
DSCR
1.97
1% rule
1.52%
Cash to close
$80,920
Investor read
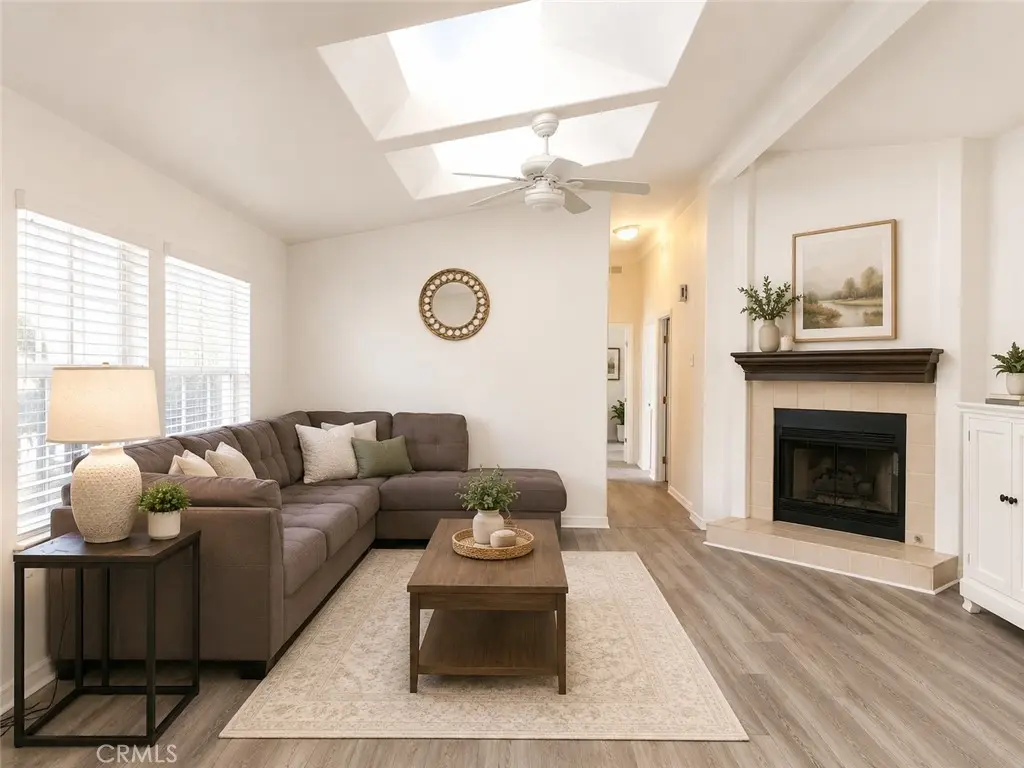
- This is a 3-bed/2.0-bath manufactured listed at $289k. Condition is rated good.
- At list price, monthly cash flow is $1k ($18k/yr) — positive.
- The deal already cash-flows at list — no discount required.
- Meets the 1% rule at list price ($4k rent vs $289k).
- Only 6 days on market — expect competitive offers; lowballing is unlikely to land.
- Local home prices are declining (-3.0%/yr); year-one equity from $2k of loan paydown is wiped out by about $9k of value loss. Plan a longer hold.
- Location reads 67/100 on livability (#306 in CA) — a middle-class / working-renter tenant base. Strengths: employment A+, commute A-, schools B+; Watch: amenities C-, cost of living F, health & safety F.
- Huntington Beach Union High (suburban): math 65% / reading 82% proficiency, ranked #39 of 517 in CA (top 8%) — strong family-tenant draw, lease renewals of 3-5y typical.
- Market conditions: Rents rising (+1.2%/yr); 116 active listings in the ZIP; 28 comparable units currently listed for rent nearby; rentals at typical pace (median 16d on market — plan ~3-4 weeks tenant-placement turnaround); high-income renter base; 6,974 units permitted in Orange County in 2024 (3,839 in 5+ unit buildings).
- Orange County population projected at +14% by 2050 — modest demand growth; plan on rents tracking national, not racing it.
- At projected returns (-3.0% appreciation + 1.2% rent growth), your $81k cash investment doubles in ~7 years — after that, you're playing with house money.
- Climate carrying-cost: moderate flood risk; extreme-heat days projected 7→23/yr by 2055 (HVAC capex compounding) — expect insurance premiums to compound above CPI over the hold.
- Cap rate 12.4% vs local median 1.6% in Huntington Beach — top-decile yield for the area; either an underpriced asset or a hidden risk that comps aren't pricing in. Stress-test before assuming the spread holds.
- This rent runs 40% of the median local income ($131k/yr) — at the standard rent-burdened threshold; future hikes will face affordability resistance.
Questions for listing agent
- Is there a deadline driving the sale (1031 exchange, divorce, estate, relocation)? That informs how much negotiation room exists.
- Schools are B-rated — typically a magnet for longer-tenancy family renters. What's the average tenant stay here, and is there a school-zone premium baked into asking?
- What's the average days-on-market for RENTAL listings here right now (not sales)? A rising rental-DOM trend means longer vacancies and softer asking-rent achievability than the comps imply.
- What's the recent tenant-quality profile in this submarket — average credit score on applications, eviction rate, late-payment / NSF rate, and stable-employment percentage? A property-management company in the area should have these aggregated.
- How much new for-sale + rental construction is in the pipeline within 1–3 miles? Heavy new supply typically softens prices + rents 12–24 months out; constrained supply supports both.
CashFlowRE · CFR-0ZP0EKFYFECA02
· Data 1 week ago
cashflowre.app · 2026-05-29