9850 Garfield · Huntington Beach, CA
Flood risk 5/10 · Moderate
- FEMA flood zone
- X
- Chance of flooding over 30 yrs
- 0.27%
- Est. flood insurance / yr
- $507 – $1,088
Fire risk 1/10 · Minimal
- Est. fire insurance / yr
- $659 – $1,223
Heat risk 5/10 · Moderate
- Hot days now (above 85°F)
- 7 days/yr
- Hot days in 30 yrs
- 23 days/yr
Wind risk 1/10 · Minimal
- Chance of severe wind over 30 yrs
- —
Air-quality risk 4/10 · Minor
- Unhealthy air days now
- 5 days/yr
- Unhealthy air days in 30 yrs
- 7 days/yr
Risk factors via First Street. Map © Google.
Why this score? — see what drove the B- grade
The composite is a weighted blend of 9 inputs, each scored 0–100. Each bar is that input's sub-score; the figure is the points it added to the 100-point composite (weight × sub-score).
- Cash flow +30.0/30.0
- 1% rule +10.0/10.0
- DSCR +10.0/10.0
- Schools +6.5/10.0
- Condition / age +4.0/5.0
- Livability +3.4/5.0
- Rent growth +2.8/5.0
- ARV discount +0.0/15.0
- Appreciation +0.0/10.0
$289,000
🖨 Deal sheet 📄 Offer letter ✓ Due diligence
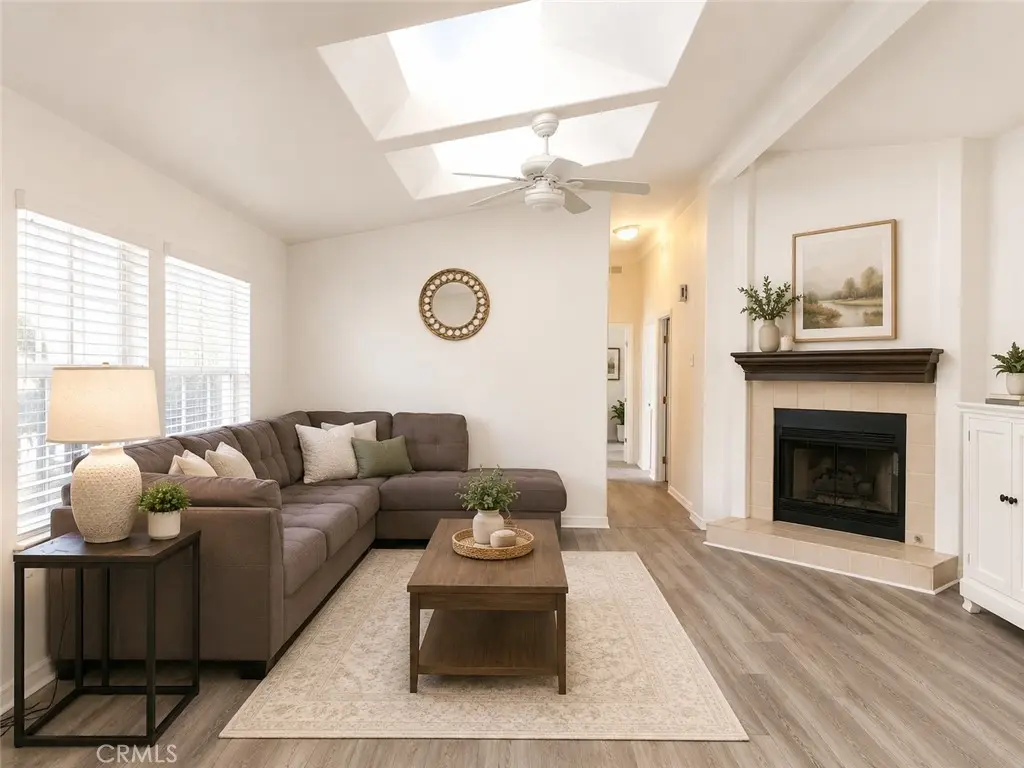
Listing remarks
3 Bedroom 2 Bath, Wood floors, front porch with private rear patio, Island kitchen, formal dining room, cozy fireplace, located in one of Orange County's most desirable manufactured home communities.
Key facts
- Formal dining room
- Island kitchen
- Front porch
Tags
Property features AI
Finance
- Other: Property located at 9850 Garfield, Huntington Beach, CA 92646; Directions: enter community and immediately turn left
- Financial info: Land lease of $2,150 per month (park-managed)
- HOA & community: Senior community; Suburban community
Exterior
- Parking: Located in Brookfield Manor park
- Utilities: Public sewer; District/Public water
- Home design: Single-story property; Mobile home remains on site; Mobile dimensions approximately 27 ft wide by 56 ft long; Living area reported as estimated; Year built reported as estimated
- Construction: Parcel number 89151091
- Exterior features: Community pool; Level with street lot
Interior
- Bathrooms: 2 full bathrooms
- Interior features: Entry located on level 1
- Laundry & utility: Laundry inside the home
Neighborhood map
What this means for you Summary
Snapshot
- This is a 3-bed/2.0-bath manufactured listed at $289k. Condition is rated good.
Deal economics
- At list price, monthly cash flow is $1k ($18k/yr) — positive.
- The deal already cash-flows at list — no discount required.
- Meets the 1% rule at list price ($4k rent vs $289k).
- Cap rate 12.4% vs local median 1.6% in Huntington Beach — top-decile yield for the area; either an underpriced asset or a hidden risk that comps aren't pricing in. Stress-test before assuming the spread holds.
Location & tenants
- Location reads 67/100 on livability (#306 in CA) — a middle-class / working-renter tenant base. Strengths: employment A+, commute A-, schools B+; Watch: amenities C-, cost of living F, health & safety F.
- Huntington Beach Union High (suburban): math 65% / reading 82% proficiency, ranked #39 of 517 in CA (top 8%) — strong family-tenant draw, lease renewals of 3-5y typical.
- Market conditions: Rents rising (+1.2%/yr); 116 active listings in the ZIP; 28 comparable units currently listed for rent nearby; rentals at typical pace (median 15d on market — plan ~3-4 weeks tenant-placement turnaround); high-income renter base; 6,974 units permitted in Orange County in 2024 (3,839 in 5+ unit buildings).
- This rent runs 40% of the median local income ($131k/yr) — at the standard rent-burdened threshold; future hikes will face affordability resistance.
Forward outlook
- Local home prices are declining (-3.0%/yr); year-one equity from $2k of loan paydown is wiped out by about $9k of value loss. Plan a longer hold.
- Orange County population projected at +14% by 2050 — modest demand growth; plan on rents tracking national, not racing it.
- At projected returns (-3.0% appreciation + 1.2% rent growth), your $81k cash investment doubles in ~7 years — after that, you're playing with house money.
Negotiation context
- Only 6 days on market — expect competitive offers; lowballing is unlikely to land.
Risks & watch-outs
- Climate carrying-cost: moderate flood risk; extreme-heat days projected 7→23/yr by 2055 (HVAC capex compounding) — expect insurance premiums to compound above CPI over the hold.
Questions for the listing agent
- Is there a deadline driving the sale (1031 exchange, divorce, estate, relocation)? That informs how much negotiation room exists.
- Schools are B-rated — typically a magnet for longer-tenancy family renters. What's the average tenant stay here, and is there a school-zone premium baked into asking?
- What's the average days-on-market for RENTAL listings here right now (not sales)? A rising rental-DOM trend means longer vacancies and softer asking-rent achievability than the comps imply.
- What's the recent tenant-quality profile in this submarket — average credit score on applications, eviction rate, late-payment / NSF rate, and stable-employment percentage? A property-management company in the area should have these aggregated.
- How much new for-sale + rental construction is in the pipeline within 1–3 miles? Heavy new supply typically softens prices + rents 12–24 months out; constrained supply supports both.
Investment metrics
- 1% rule
- 1.52% ✓
- Cap rate
- 12.39%
- Cash-on-cash
- 21.78%
- DSCR
- 1.97
- GRM
- 5.5
CMA / ARV
- ARV (on-the-fly)
- $202,800
- Comps found
- 12
Show comp detail 12 sales within ~0.75 mi
| Address | Dist | Beds/Ba | Sqft | Sold | Price | $/sf | Match |
|---|---|---|---|---|---|---|---|
| 9850 Garfield #129 | 0.01mi | 3/2.0 | 1,560 (0%) | 2mo | $285,000 | $183 | 98 |
| 9850 Garfield Ave #63 | 0.01mi | 3/2.0 | 1,593 (+2%) | 12mo | $295,000 | $185 | 86 |
| 9850 Garfield Ave #74 | 0.01mi | 3/2.0 | 1,750 (+12%) | 0mo | $312,500 | $179 | 79 |
| 19251 Brookhurst St #71 | 0.10mi | 2/2.0 (-1) | 1,608 (+3%) | 10mo | $125,000 | $78 | 77 |
| 19361 Brookhurst St #51 | 0.31mi | 3/2.0 | 1,536 (-2%) | 12mo | $161,000 | $105 | 73 |
| 19361 Brookhurst St #33 | 0.31mi | 3/2.0 | 1,680 (+8%) | 4mo | $277,365 | $165 | 69 |
| 19251 Brookhurst St #95 | 0.08mi | 2/2.0 (-1) | 1,440 (-8%) | 11mo | $103,000 | $72 | 69 |
| 19361 Brookhurst #101 | 0.31mi | 3/2.0 | 1,440 (-8%) | 4mo | $208,000 | $144 | 69 |
| 19361 Brookhurst St #12 | 0.31mi | 3/2.0 | 1,651 (+6%) | 12mo | $215,000 | $130 | 66 |
| 19251 Brookhurst St #22 | 0.20mi | 3/2.0 | 1,344 (-14%) | 3mo | $172,000 | $128 | 66 |
| 19361 Brookhurst St #120 | 0.31mi | 2/2.0 (-1) | 1,500 (-4%) | 11mo | $138,000 | $92 | 65 |
| 19361 Brookhurst St #34 | 0.33mi | 2/2.0 (-1) | 1,404 (-10%) | 11mo | $156,000 | $111 | 54 |
Match score weights: distance 35% · size 25% · config 20% · recency 20%. Top-matched comps best support the ARV.
Projected returns pro-forma
-3.0% appreciation · 1.2% rent growth · sell at horizon
- IRR
- 12.4%
- Equity multiple
- 1.48×
- Total profit
- $38,985
- Equity at exit
- $43,091
- IRR
- 19.9%
- Equity multiple
- 2.53×
- Total profit
- $123,790
- Equity at exit
- $24,987
Cash invested: $80,920 (down + closing). Projections, not guarantees.
Landlord ↔ Tenant lean methodology
- Overall (STATE)
- 18 Strongly Tenant-Friendly
- State California
- 18 Strongly Tenant-Friendly · D+13
- County
- — inherits STATE
- City
- — inherits STATE
ZIP-level market 92646
- Rents YoY
- 1.2%
- Active inventory
- 116
- Price-to-rent
- 5.5×
Monthly cashflow live
- Estimated rent
- $4,388 high interval (Pro) →
- Mortgage (P&I)
- −$1,516
- Tax est. 1.5%
- −$361 /mo · $4,335/yr
- Insurance
- −$120
- HOA
- −$0
- Vacancy / Maint / Mgmt
- −$921
- Net cashflow
- $1,469
Break-even live
UW: 25.0% down · 7.5% · 30yr · 1.5% tax · 5.0% vac · 8.0% maint · 8.0% mgmt
Financing live
Cash to close
- Down payment
- $72,250
- Closing costs
- $8,670
- Reserves months
- —
- Total cash needed
- —
Loan-product check · same deal, 3 products live
Conventional
25% down · 7.5% · 30yr
- Down + closing
- —
- Monthly P&I
- —
- Monthly cashflow
- —
- DSCR
- —
- Eligible?
- —
Personal DTI + credit; lowest rate.
DSCR
20% down · 8.5% · 30yr
- Down + closing
- —
- Monthly P&I
- —
- Monthly cashflow
- —
- DSCR
- —
- Eligible?
- —
No personal income docs; deal must DSCR.
Hard money
10% down · 12.0% · 12mo
- Down + closing
- —
- Monthly P&I
- —
- Monthly cashflow
- —
- DSCR
- —
- Eligible?
- —
Short-term bridge; refi at stabilization.
Rent comps 28 comps
| Address | Beds | Baths | Sqft | Rent | $/sqft | DOM | Units | Dist |
|---|---|---|---|---|---|---|---|---|
| 9704 Lark Cir Fountain Valley, CA | 4.0 | 2.5 | 1528 | $4,600 | $3.01 | 22d | 1 | 0.62mi |
| 19754 Kingswood Ln Huntington Beach, CA | 4.0 | 1.5 | 1254 | $3,595 | $2.87 | 1d | 1 | 0.71mi |
| 19775 Cambridge Ln Huntington Beach, CA | 3.0 | 2.5 | 1122 | $3,495 | $3.11 | 1d | 1 | 0.72mi |
| 9552 Bickley Dr #7 Huntington Beach, CA | 3.0 | 1.5 | 1100 | $3,500 | $3.18 | 1d | 1 | 0.75mi |
| 19844 Inverness Ln Huntington Beach, CA | 4.0 | 1.5 | 1254 | $3,675 | $2.93 | 1d | 1 | 0.80mi |
| 10107 Holburn Dr Huntington Beach, CA | 3.0 | 1.5 | 1122 | $3,500 | $3.12 | 1d | 1 | 0.81mi |
| 9021 Hyde Park Dr Huntington Beach, CA | 4.0 | 2.5 | 1818 | $5,750 | $3.16 | 1d | 1 | 0.81mi |
| 9022 Hyde Park Dr Huntington Beach, CA | 4.0 | 2.5 | 1868 | $4,995 | $2.67 | 24d | 1 | 0.82mi |
| 9582 Pettswood Dr Huntington Beach, CA | 3.0 | 1.5 | 1178 | $3,700 | $3.14 | 19d | 1 | 0.82mi |
| 9582 Pettswood Dr Huntington Beach, CA | 3.0 | 1.5 | 1174 | $3,700 | $3.15 | 16d | 1 | 0.82mi |
| 9595 Toucan Ave Fountain Valley, CA | 3.0 | 2.5 | 1548 | $4,200 | $2.71 | 16d | 1 | 0.83mi |
| 18236 Sanmian Ct Fountain Valley, CA | 3.0 | 3.0 | 1690 | $4,100 | $2.43 | 22d | 1 | 0.85mi |
| 19343 McLaren Ln Huntington Beach, CA | 3.0 | 2.0 | 1654 | $4,000 | $2.42 | 24d | 1 | 0.86mi |
| 9111 Warfield Dr Huntington Beach, CA | 4.0 | 2.5 | 1812 | $5,500 | $3.04 | 24d | 1 | 0.88mi |
| 19901 Sheffield Ln Huntington Beach, CA | 4.0 | 1.5 | 1254 | $3,795 | $3.03 | 16d | 1 | 0.90mi |
| 9727 Adams Ave Huntington Beach, CA | 3.0 | 2.5 | 1122 | $3,300 | $2.94 | 1d | 1 | 0.92mi |
| 10172 Ascot Cir Huntington Beach, CA | 3.0 | 1.5 | 1122 | $4,500 | $4.01 | 1d | 1 | 0.97mi |
| 18229 Olympic Ct Fountain Valley, CA | 3.0 | 2.0 | 1144 | $4,300 | $3.76 | 1d | 1 | 0.98mi |
| 8831 Sailport Dr Huntington Beach, CA | 4.0 | 3.0 | 2224 | $6,095 | $2.74 | 1d | 1 | 1.09mi |
| 8831 Sailport Dr Huntington Beach, CA | 4.0 | 2.5 | 2224 | $6,095 | $2.74 | 18d | 1 | 1.09mi |
| 18131 S 3rd St Fountain Valley, CA | 3.0 | 2.0 | 1254 | $5,000 | $3.99 | 1d | 1 | 1.19mi |
| 9213 El Tango Cir Fountain Valley, CA | 3.0 | 3.0 | 1670 | $4,800 | $2.87 | 1d | 1 | 1.36mi |
| 9891 Hot Springs Dr Huntington Beach, CA | 3.0 | 2.0 | 1494 | $7,000 | $4.69 | 1d | 1 | 1.40mi |
| 10220 El Monterey Ave Fountain Valley, CA | 3.0 | 2.0 | 1820 | $5,000 | $2.75 | 15d | 1 | 1.40mi |
| 10220 El Monterey Ave Fountain Valley, CA | 3.0 | 2.0 | 1820 | $5,000 | $2.75 | 16d | 1 | 1.40mi |
| 1803 Iowa St Costa Mesa, CA | 3.0 | 2.0 | 1550 | $4,300 | $2.77 | 20d | 1 | 1.43mi |
| 17698 Locust St Fountain Valley, CA | 4.0 | 2.0 | 2014 | $7,000 | $3.48 | 2d | 1 | 1.45mi |
| 8579 Volga River Cir Fountain Valley, CA | 3.0 | 2.0 | 1425 | $3,500 | $2.46 | 24d | 1 | 1.46mi |
Listing history 5 events
-
2026-06-09days on market $289,000 Active 6 DOM
-
2026-06-08days on market $289,000 Active 5 DOM
-
2026-06-07days on market $289,000 Active 4 DOM
-
2026-06-04remarks 199-char remark
-
2026-06-04$289,000 Active 1 DOM
ⓘ Source: listings_history table (triggers on properties + properties_extension) + one-shot
backfill from property_details.listing_events for pre-trigger history.
Climate risk First Street
- Flood 5/10 Major FEMA zone X · 27% chance over 30 yrs
- Wildfire 1/10 Low
- Heat 5/10 Major 7 d/yr ≥85°F today · 23 d/yr by 30 yrs out
- Wind 1/10 Low
- Air quality 4/10 Moderate 5 unhealthy d/yr today · 7 by 30 yrs out
Nearby sold comps map
Loading sold comps map…
Walkable amenities ~0.75 mi
Loading nearby amenities…
Taxation est. · year 1
- Rental income
- $52,650
- − Mortgage interest
- −$16,188
- − Property taxes
- −$4,335
- − Insurance
- −$1,445
- − Repairs & maintenance
- −$4,212
- − Management
- −$4,212
- − Depreciation
- −$8,407
- Taxable income
- $13,850
- Est. tax owed @ 24.0%
- −$3,324
- After-tax cash flow
- $14,303/yr
For passive investors: Depreciation is non-cash, so a rental often shows a tax loss while cash-flowing — sheltering income. Rental losses are passive: they offset passive income freely, and up to $25,000/yr can offset ordinary (W-2) income if you actively participate and your MAGI is under $100k (phasing out to $0 by $150k); unused losses carry forward. On sale, claimed depreciation is recaptured at up to 25%, and gains may owe capital-gains tax (a 1031 exchange can defer both). Figures are a year-1 estimate at your 24.0% rate — not tax advice; consult a CPA.
Condition & rehab AI · 13 photos
This manufactured home is in good condition with a well-maintained exterior and interior. It has a good roof, flooring, and HVAC system. The property is located in a desirable manufactured home community and is move-in ready.
Value-add opportunities
- Resale Paint exterior siding — Fresh paint can enhance curb appeal and property value.
- Rental Clean gutters — Clean gutters improve drainage and prevent water damage, which is important for rental properties.
Renovation cost estimate screening
Value-add ROI direction
- Resale Paint exterior siding — Fresh paint can enhance curb appeal and property value. ↑
- Rental Clean gutters — Clean gutters improve drainage and prevent water damage, which is important for rental properties. ↑
ⓘ Cost ranges are severity-bucket heuristics (US national rule-of-thumb). Get contractor quotes + a written scope before underwriting a rehab budget.
Schools (NCES district)
- District
- Huntington Beach Union High
- NCES district ID
- 0618060
- Math proficiency
- 65% ▲ 17.00%
- Reading proficiency
- 82% ▲ 8.00%
- Median HH income
- $78,159
- Composite
- 64.9/100
- National rank
- #511
- State rank
- #39 of 517 in CA
Livability — Huntington Beach
- Score
- 67/100
- State rank
- #306
- US rank
- #10298
Category grades
Schools grade is shown separately in the Schools card above.
Census & demographics
- Census place
- Huntington Beach, CA
- County
- Orange County · 3,096,323 people
- City population
- 194,835
- Metro
- Los Angeles-Long Beach-Anaheim, CA
- Population (ZIP)
- 54,615
- Household income
- $130,672
- Rent vs Own
- Severe rent burden
- 1226.0
Population outlook (Orange County) Hauer SSP2
- Today (2025)
- 3,477,456 people
- By 2030
- 3,613,117 · +3.9%
- By 2040
- 3,835,945 · +10.3%
- By 2050
- 3,968,736 · +14.1%
- By 2075
- 4,097,053 · +17.8%
- By 2100
- 3,903,633 · +12.3%
Race, ethnicity, and origin ACS 2023
- Neighborhood character
- Diverse neighborhood (Simpson 0.56)
- Race & ethnicity
- White 63% Hispanic / Latino 16% Asian 13% Two or more races 13%
- Hispanic origin (detail)
- Mexican 11%
- Common ancestry
- Italian 3% Romanian 2% Lithuanian 2%
- Foreign-born
- 15% · Vietnam, Canada, China
- Languages at home
- 80% English-only · Spanish 7% Vietnamese 5% Chinese 2%
Political lean MEDSL · Orange
- 2024 margin
- Toss-up / Even · D 49.7% · R 47.1% · Other 3.2%
- 2008→2024 swing
- +5.2pp toward D · 2008: -2.6pp · 2024: 2.6pp
- All cycles
- 2024: D+2.6 2020: D+9.0 2016: D+7.7 2012: R+8.3 2008: R+2.6
Not yet ingested
- Civics
- —
Market trends
- HPI YoY
- ▼ -1082.92%
- Current HPI
- 459.3987
- Rent YoY
- ▲ 1.20%
- Metro
- Los Angeles-Long Beach-Anaheim, CA
- State GDP YoY
- ▲ 3.21%
- F500 in state
- 116
Industry mix (Fortune 500 HQ in CA)
| Industry | F500 HQs | Revenue |
|---|---|---|
| Technology | 27 | $1,492B |
|
||
| Financial Services | 3 | $174B |
|
||
| Retail | 3 | $44B |
|
||
| Insurance | 3 | $26B |
|
||
| Media / Entertainment | 2 | $115B |
|
||
| Pharmaceuticals / Biotech | 2 | $62B |
|
||
Price history
1 event — show timeline
- 2026-06-03 Listed $289,000 CRMLS
Cash-flow waterfall
monthlySold comps — $/sqft
last 12 mo · ≤1 miLoading sold comps…