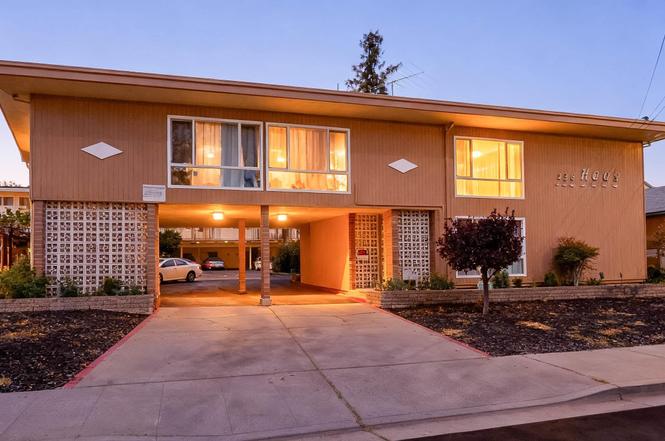
236 Haas Ave
San Leandro, CA 94577
$3,499,999D-
22 bd · 12.0 ba ·
10,430 sqft ·
Built 1960
· MultiFamily
· Active
· 1 DOM
Cashflow @ list (25.0% down · 7.5%)
Estimated rent
$28,303/mo
Mortgage (P&I)
−$18,354
Tax + insurance
−$4,098
HOA
−$0
Vac / Maint / Mgmt
−$5,944
Net cashflow
$-93/mo
Annual
$-1,115/yr
Cap rate
6.26%
Cash-on-cash
-0.11%
DSCR
0.99
1% rule
0.81%
Cash to close
$980,000
Investor read
- This is a 10×2bd/1.5ba + 2×1bd/1.5ba units multifamily listed at $3.50M.
- At list price, monthly cash flow is $-93 ($-1k/yr) — negative. Per door: $-8/mo.
- To cash-flow at today's rent, offer at most $3.48M (0.5% below list).
- To meet the 1% rule (rent ≥ 1% of price), the offer needs to be $2.83M (19.1% below list).
- Only 1 days on market — expect competitive offers; lowballing is unlikely to land.
- Recommended offer: $2.83M (19.1% below list) — sets the bar for 1% rule.
- Local home prices are declining (-3.0%/yr); year-one equity from $24k of loan paydown is wiped out by about $105k of value loss. Plan a longer hold.
- Location reads 68/100 on livability (#289 in CA) — a middle-class / working-renter tenant base. Strengths: commute A+, employment A+, health & safety A+; Watch: amenities C-, schools D, crime F.
- San Leandro Unified (urban): math 28% / reading 42% proficiency, ranked #831 of 1,400 in CA (top 59%) — families likely to look elsewhere, expect single-tenant / working-renter base with shorter leases.
- Market conditions: Rents rising (+1.7%/yr); 106 active listings in the ZIP; solid renter incomes; 1,742 units permitted in Alameda County in 2024 (856 in 5+ unit buildings).
- Alameda County population projected at +34% by 2050 — long-run rental-demand tailwind backs the buy-and-hold thesis.
- 2 sale attempts since 13y ago with the ask held roughly flat each time — persistent listings suggest the price (not the market) is what's stuck; bring a comps-based counter.
- Current owner paid $1.60M; list at $3.50M implies a 119% gain — meaningful room to come down on a strong offer.
- Cap rate 6.3% vs local median 2.0% in San Leandro — top-decile yield for the area; either an underpriced asset or a hidden risk that comps aren't pricing in. Stress-test before assuming the spread holds.
- At $28,303/mo this rent would consume 312% of the median local household income ($109k/yr) (locally 2005% of renters already pay >50% of income on rent) — very limited rent-growth headroom before tenants either downsize or default.
Questions for listing agent
- What do current leases actually rent for vs. the listed asking? Can we see a recent rent roll and the last 12 months of T-12 income?
- Can we see the unit-by-unit rent roll, current vacancy, and any below-market leases? What's the average tenancy length?
- What capital expenditures (roof, boiler, parking lot, exteriors) have been made in the last 5 years, and what's planned in the next 2?
- Built in 1960 — when were the roof, HVAC, electrical panel, plumbing, and water heater last replaced?
- Is there a deadline driving the sale (1031 exchange, divorce, estate, relocation)? That informs how much negotiation room exists.
- Schools are D-rated, which usually means shorter tenancies and higher turnover. Who's the typical renter profile here, and what's been the actual vacancy rate?
- Crime grade is F in this area — have there been break-ins, vandalism, or insurance claims at this property in the last 3 years? What carrier currently insures it and at what premium?
- The area grade is low — what's the realistic commute time and amenity access for the typical tenant pool here? Any planned neighborhood developments (good or bad) we should know about?
CashFlowRE · CFR-0ZTKWYEHSC2KDC
· Data 2 days ago
cashflowre.app · 2026-05-29