 12-Plex
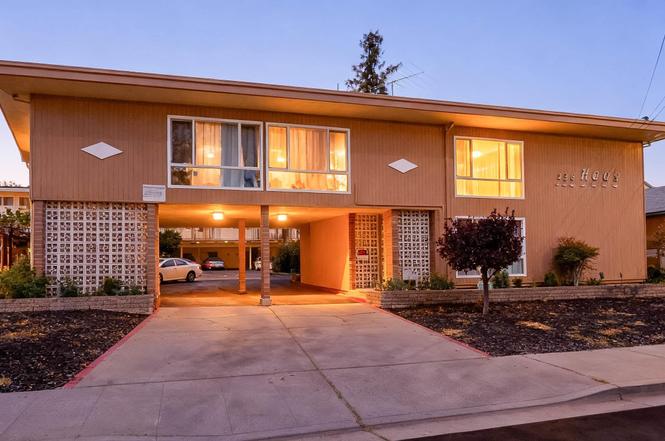
236 Haas Ave · San Leandro, CA
Flood risk 1/10 · Minimal
- FEMA flood zone
- X (unshaded)
- Chance of flooding over 30 yrs
- 0.0%
- Est. flood insurance / yr
- $507 – $1,088
Fire risk 2/10 · Minimal
- Est. fire insurance / yr
- $659 – $1,223
Heat risk 4/10 · Minor
- Hot days now (above 84°F)
- 7 days/yr
- Hot days in 30 yrs
- 15 days/yr
Wind risk 1/10 · Minimal
- Chance of severe wind over 30 yrs
- —
Air-quality risk 8/10 · Major
- Unhealthy air days now
- 14 days/yr
- Unhealthy air days in 30 yrs
- 14 days/yr
Risk factors via First Street. Map © Google.
Why this score? — see what drove the D- grade
The composite is a weighted blend of 9 inputs, each scored 0–100. Each bar is that input's sub-score; the figure is the points it added to the 100-point composite (weight × sub-score).
- Cash flow +13.2/30.0
- ARV discount +7.5/15.0
- DSCR +3.9/10.0
- Schools +3.4/10.0
- Livability +3.4/5.0
- 1% rule +3.1/10.0
- Rent growth +2.9/5.0
- Condition / age +2.5/5.0
- Appreciation +0.0/10.0
$3,499,999
🖨 Deal sheet 📄 Offer letter ✓ Due diligence
Multi-family units
County records classify this as Multi-Family (5+ Unit). Listing-text estimate: 12 units. confirmed
5+ unit building — per-unit beds/baths from public records are typically unavailable; the breakdown below (if shown) is an estimate from the listing text.
Listing remarks MLS
Located near the heart of downtown San Leandro, this apartment building has been owned by the same family for many years and has been lovingly maintained. Each unit is individually metered for gas & electric. On site laundry room.
Key facts
- 0.3 acre lot
- Built 1960
Property features AI
Finance
- Other: Total building area 12,900 square feet; Total of 12 residential units
- Financial info: No financial details provided
Exterior
- Parking: Total of 12 parking spaces; Carports (two or more), covered and assigned spaces, off-site parking available
- Security: No security features provided
- Utilities: Public water; Public sewer; Individual electric and gas meters
- Home design: Apartment complex (multi-unit, 5+ units); Built in 1960; Stucco exterior
- Construction: Stucco construction
- Exterior features: Level lot with front yard
Interior
- Kitchen: No kitchen appliance details provided
- Bedrooms: Twelve 2-bedroom units
- Flooring: Hardwood; Linoleum; Carpet
- Bathrooms: Twelve 1-bathroom units
- Heating & cooling: Wall furnaces; Ceiling fans
- Interior features: Double-pane windows with window coverings; Coin-operated common laundry room (washer and dryer); Gas water heater
- Laundry & utility: Common-area laundry room with coin-operated washer and dryer; Individual electric and gas meters
Neighborhood map
What this means for you Summary
Snapshot
- This is a 10×2bd/1.5ba + 2×1bd/1.5ba units multifamily listed at $3.50M.
Deal economics
- At list price, monthly cash flow is $-93 ($-1k/yr) — negative. Per door: $-8/mo.
- To cash-flow at today's rent, offer at most $3.48M (0.5% below list).
- To meet the 1% rule (rent ≥ 1% of price), the offer needs to be $2.83M (19.1% below list).
- Recommended offer: $2.83M (19.1% below list) — sets the bar for 1% rule.
- Cap rate 6.3% vs local median 2.0% in San Leandro — top-decile yield for the area; either an underpriced asset or a hidden risk that comps aren't pricing in. Stress-test before assuming the spread holds.
Location & tenants
- Location reads 68/100 on livability (#289 in CA) — a middle-class / working-renter tenant base. Strengths: commute A+, employment A+, health & safety A+; Watch: amenities C-, schools D, crime F.
- San Leandro Unified (urban): math 28% / reading 42% proficiency, ranked #831 of 1,400 in CA (top 59%) — families likely to look elsewhere, expect single-tenant / working-renter base with shorter leases.
- Market conditions: Rents rising (+1.7%/yr); 106 active listings in the ZIP; solid renter incomes; 1,742 units permitted in Alameda County in 2024 (856 in 5+ unit buildings).
- At $28,303/mo this rent would consume 312% of the median local household income ($109k/yr) (locally 2005% of renters already pay >50% of income on rent) — very limited rent-growth headroom before tenants either downsize or default.
Forward outlook
- Local home prices are declining (-3.0%/yr); year-one equity from $24k of loan paydown is wiped out by about $105k of value loss. Plan a longer hold.
- Alameda County population projected at +34% by 2050 — long-run rental-demand tailwind backs the buy-and-hold thesis.
Negotiation context
- Only 1 days on market — expect competitive offers; lowballing is unlikely to land.
- 2 sale attempts since 13y ago with the ask held roughly flat each time — persistent listings suggest the price (not the market) is what's stuck; bring a comps-based counter.
- Current owner paid $1.60M; list at $3.50M implies a 119% gain — meaningful room to come down on a strong offer.
Questions for the listing agent
- What do current leases actually rent for vs. the listed asking? Can we see a recent rent roll and the last 12 months of T-12 income?
- Can we see the unit-by-unit rent roll, current vacancy, and any below-market leases? What's the average tenancy length?
- What capital expenditures (roof, boiler, parking lot, exteriors) have been made in the last 5 years, and what's planned in the next 2?
- Built in 1960 — when were the roof, HVAC, electrical panel, plumbing, and water heater last replaced?
- Is there a deadline driving the sale (1031 exchange, divorce, estate, relocation)? That informs how much negotiation room exists.
- Schools are D-rated, which usually means shorter tenancies and higher turnover. Who's the typical renter profile here, and what's been the actual vacancy rate?
- Crime grade is F in this area — have there been break-ins, vandalism, or insurance claims at this property in the last 3 years? What carrier currently insures it and at what premium?
- The area grade is low — what's the realistic commute time and amenity access for the typical tenant pool here? Any planned neighborhood developments (good or bad) we should know about?
- What's the average days-on-market for RENTAL listings here right now (not sales)? A rising rental-DOM trend means longer vacancies and softer asking-rent achievability than the comps imply.
- What's the recent tenant-quality profile in this submarket — average credit score on applications, eviction rate, late-payment / NSF rate, and stable-employment percentage? A property-management company in the area should have these aggregated.
- How much new apartment / multifamily construction is in the pipeline within 1–3 miles? Heavy new supply (>2% of stock underway) typically softens rents 12–24 months out; light construction supports rent growth.
Investment metrics
- 1% rule
- 0.81% ✗
- Cap rate
- 6.26%
- Cash-on-cash
- -0.11%
- DSCR
- 0.99
- GRM
- 10.3
CMA / ARV
No comps found within radius.
Projected returns pro-forma
-3.0% appreciation · 1.74% rent growth · sell at horizon
- IRR
- -17.8%
- Equity multiple
- 0.38×
- Total profit
- $-609,145
- Equity at exit
- $521,861
- IRR
- -12.5%
- Equity multiple
- 0.30×
- Total profit
- $-682,426
- Equity at exit
- $302,616
Cash invested: $980,000 (down + closing). Projections, not guarantees.
Landlord ↔ Tenant lean methodology
- Overall (STATE)
- 18 Strongly Tenant-Friendly
- State California
- 18 Strongly Tenant-Friendly · D+13
- County
- — inherits STATE
- City
- — inherits STATE
ZIP-level market 94577
- Rents YoY
- 1.7%
- Active inventory
- 106
- Price-to-rent
- 121.9×
Monthly cashflow live
- Estimated rent
- $28,303 high interval (Pro) →
- Mortgage (P&I)
- −$18,354
- Tax from tax record
- −$2,640 /mo · $31,675/yr
- Insurance
- −$1,458
- HOA
- −$0
- Vacancy / Maint / Mgmt
- −$5,944
- Net cashflow
- $-93
Break-even live
12-unit breakdown (identical units grouped — click to expand)
| Units | Beds | Baths | Est. rent |
|---|---|---|---|
| 10× units | 2 | 1.5 | $23,920 |
| #1 | 2 | 1.5 | $2,392 |
| #2 | 2 | 1.5 | $2,392 |
| #3 | 2 | 1.5 | $2,392 |
| #4 | 2 | 1.5 | $2,392 |
| #5 | 2 | 1.5 | $2,392 |
| #6 | 2 | 1.5 | $2,392 |
| #7 | 2 | 1.5 | $2,392 |
| #8 | 2 | 1.5 | $2,392 |
| #9 | 2 | 1.5 | $2,392 |
| #10 | 2 | 1.5 | $2,392 |
| 2× units | 1 | 1.5 | $4,386 |
| #11 | 1 | 1.5 | $2,193 |
| #12 | 1 | 1.5 | $2,193 |
| Total (12 units) | $28,303 | ||
UW: 25.0% down · 7.5% · 30yr · 1.5% tax · 5.0% vac · 8.0% maint · 8.0% mgmt
Financing live
Cash to close
- Down payment
- $875,000
- Closing costs
- $105,000
- Reserves months
- —
- Total cash needed
- —
Loan-product check · same deal, 3 products live
Conventional
25% down · 7.5% · 30yr
- Down + closing
- —
- Monthly P&I
- —
- Monthly cashflow
- —
- DSCR
- —
- Eligible?
- —
Personal DTI + credit; lowest rate.
DSCR
20% down · 8.5% · 30yr
- Down + closing
- —
- Monthly P&I
- —
- Monthly cashflow
- —
- DSCR
- —
- Eligible?
- —
No personal income docs; deal must DSCR.
Hard money
10% down · 12.0% · 12mo
- Down + closing
- —
- Monthly P&I
- —
- Monthly cashflow
- —
- DSCR
- —
- Eligible?
- —
Short-term bridge; refi at stabilization.
Listing history 2 events
-
2026-06-18remarks 560-char remark
-
2026-06-18$3,499,999 Active 1 DOM
ⓘ Source: listings_history table (triggers on properties + properties_extension) + one-shot
backfill from property_details.listing_events for pre-trigger history.
Tax reassessment forecast CA · Resets to sale price
- Current annual tax
- $31,675 · $2,640/mo
- Projected year-2 tax
- $31,675 · $2,640/mo
- Expected delta
- $0/yr ($0/mo · 0.0%)
ⓘ Screening estimate from a state-policy table — verify with the county assessor before closing.
Climate risk First Street
- Flood 1/10 Low FEMA zone X (unshaded) · 0% chance over 30 yrs
- Wildfire 2/10 Low
- Heat 4/10 Moderate 7 d/yr ≥84°F today · 15 d/yr by 30 yrs out
- Wind 1/10 Low
- Air quality 8/10 Severe 14 unhealthy d/yr today · 14 by 30 yrs out
Nearby sold comps map
Loading sold comps map…
Walkable amenities ~0.75 mi
Loading nearby amenities…
Taxation est. · year 1
- Rental income
- $339,636
- − Mortgage interest
- −$196,054
- − Property taxes
- −$31,675
- − Insurance
- −$17,500
- − Repairs & maintenance
- −$27,171
- − Management
- −$27,171
- − Depreciation
- −$101,818
- Taxable loss
- −$61,753
- Est. tax savings @ 24.0%
- +$14,821
- After-tax cash flow
- $13,706/yr
For passive investors: Depreciation is non-cash, so a rental often shows a tax loss while cash-flowing — sheltering income. Rental losses are passive: they offset passive income freely, and up to $25,000/yr can offset ordinary (W-2) income if you actively participate and your MAGI is under $100k (phasing out to $0 by $150k); unused losses carry forward. On sale, claimed depreciation is recaptured at up to 25%, and gains may owe capital-gains tax (a 1031 exchange can defer both). Figures are a year-1 estimate at your 24.0% rate — not tax advice; consult a CPA.
Schools (NCES district)
- District
- San Leandro Unified
- NCES district ID
- 0634680
- Math proficiency
- 28% ▲ 3.00%
- Reading proficiency
- 42% ▲ 5.00%
- Median HH income
- $63,377
- Composite
- 34.23/100
- National rank
- #10252
- State rank
- #831 of 1400 in CA
Livability — San Leandro
- Score
- 68/100
- State rank
- #289
- US rank
- #9768
Category grades
Schools grade is shown separately in the Schools card above.
Census & demographics
- Census place
- San Leandro, CA
- County
- Alameda County · 1,614,355 people
- City population
- 88,086
- Metro
- San Francisco-Oakland-Berkeley, CA
- Population (ZIP)
- 46,317
- Household income
- $108,772
- Rent vs Own
- Severe rent burden
- 2005.0
Population outlook (Alameda County) Hauer SSP2
- Today (2025)
- 1,928,884 people
- By 2030
- 2,069,146 · +7.3%
- By 2040
- 2,338,405 · +21.2%
- By 2050
- 2,586,608 · +34.1%
- By 2075
- 3,061,911 · +58.7%
- By 2100
- 3,234,133 · +67.7%
Race, ethnicity, and origin ACS 2023
- Neighborhood character
- Highly diverse neighborhood (Simpson 0.76)
- Race & ethnicity
- Hispanic / Latino 31% Asian 28% White 23% Two or more races 14% Black 12% Native American 2% Pacific Islander 1%
- Hispanic origin (detail)
- Mexican 23%
- Common ancestry
- Russian 2% Italian 1% Lithuanian 1%
- Foreign-born
- 34% · Canada, China, Vietnam
- Languages at home
- 51% English-only · Spanish 23% Chinese 10% Tagalog/Filipino 7%
Political lean MEDSL · Alameda
- 2024 margin
- Solid D (+53.6) · D 74.6% · R 21.0% · Other 4.4%
- 2008→2024 swing
- -5.9pp toward R · 2008: 59.5pp · 2024: 53.6pp
- All cycles
- 2024: D+53.6 2020: D+62.5 2016: D+64.4 2012: D+59.8 2008: D+59.5
Not yet ingested
- Civics
- —
Market trends
- HPI YoY
- ▼ -867.55%
- Current HPI
- 265.2446
- Rent YoY
- ▲ 1.74%
- Metro
- San Francisco-Oakland-Berkeley, CA
- State GDP YoY
- ▲ 3.21%
- F500 in state
- 116
Industry mix (Fortune 500 HQ in CA)
| Industry | F500 HQs | Revenue |
|---|---|---|
| Technology | 27 | $1,492B |
|
||
| Financial Services | 3 | $174B |
|
||
| Retail | 3 | $44B |
|
||
| Insurance | 3 | $26B |
|
||
| Media / Entertainment | 2 | $115B |
|
||
| Pharmaceuticals / Biotech | 2 | $62B |
|
||
Price history
+112.1% since first listed4 events — show timeline
- 2026-06-17 Listed $3,499,999 bridgeMLS, Bay East AOR, or Contra Costa AOR
- 2013-04-01 Sold (Public Records) $1,600,000 Public Records
- 2013-04-01 Sold (MLS) $1,600,000 bridgeMLS, Bay East AOR, or Contra Costa AOR
- 2013-03-09 Listed $1,650,000 bridgeMLS, Bay East AOR, or Contra Costa AOR
Property tax history
+4.6%/yrLatest (2025): $31,675 · +5.2% YoY. Source: county tax records.
Cash-flow waterfall
monthlySold comps — $/sqft
last 12 mo · ≤1 miLoading sold comps…