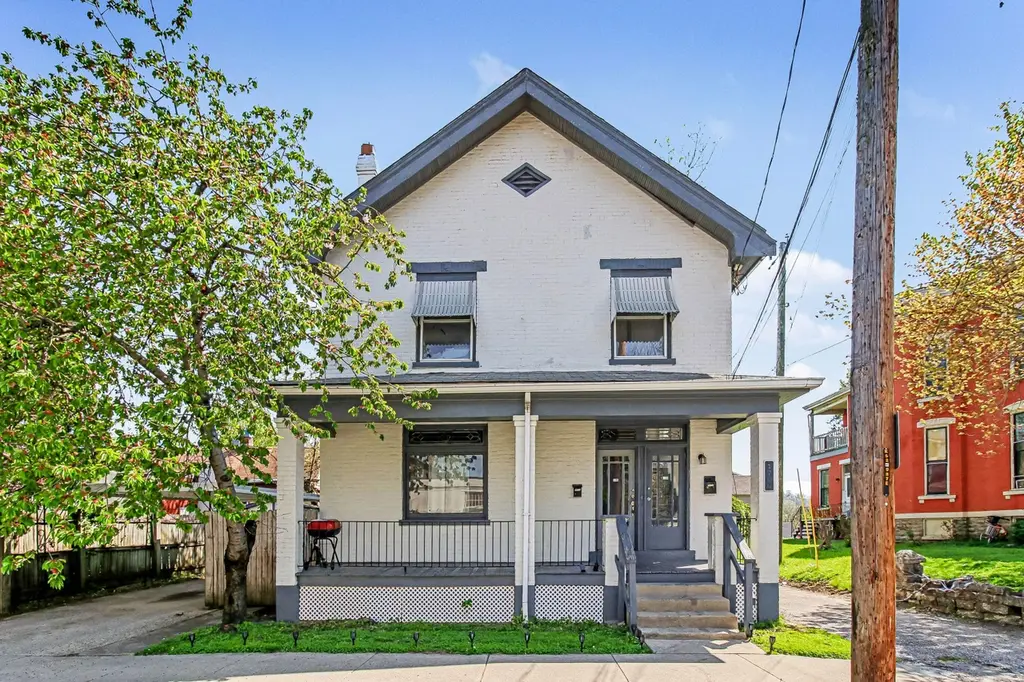
1706 Eastern Ave
Covington, KY 41014
$225,000C+
4 bd · 2.0 ba ·
1,662 sqft ·
Built —
· MultiFamily
· Pending
· 10 DOM
Cashflow @ list (25.0% down · 7.5%)
Estimated rent
$2,478/mo
Mortgage (P&I)
−$1,180
Tax + insurance
−$175
HOA
−$0
Vac / Maint / Mgmt
−$520
Net cashflow
$602/mo
Annual
$7,228/yr
Cap rate
9.51%
Cash-on-cash
11.47%
DSCR
1.51
1% rule
1.10%
Cash to close
$63,000
Investor read
- This is a 2 × 1-bed/1.0-bath units multifamily listed at $225k.
- At list price, monthly cash flow is $602 ($7k/yr) — positive. Per door: $301/mo.
- The deal already cash-flows at list — no discount required.
- Meets the 1% rule at list price ($2k rent vs $225k).
- Only 10 days on market — expect competitive offers; lowballing is unlikely to land.
- Local home prices are declining (-3.0%/yr); year-one equity from $2k of loan paydown is wiped out by about $7k of value loss. Plan a longer hold.
- Location reads 86/100 on livability (#40 in KY, #376 nationally) — a professional / high-income tenant draw. Strengths: amenities A+, commute A+, cost of living A+; Watch: employment D+.
- Covington Independent (suburban): math 10% / reading 27% proficiency, ranked #162 of 165 in KY (top 98%) — low school quality limits family demand, transient renter base, plan for 1-2y turnover; 78% free/reduced lunch — lower-income household profile, screen leases tightly.
- Zoned schools: Sixth District Elementary School (math 8% / reading 17%, grade F, #630 of 676 statewide, top 95%, 446 students, 84% FRL); Holmes Middle School (math 8% / reading 26%, grade F, #211 of 217 statewide, top 97%, 656 students, 84% FRL); Holmes High School (math 12% / reading 17%, grade F, #227 of 254 statewide, top 89%, 878 students, 80% FRL) — zoned schools at 83% FRL track the district average.
- Market conditions: Rents rising fast (+5.1%/yr); 59 active listings in the ZIP; 5 comparable units currently listed for rent nearby; rentals leasing fast (median 9d on market — plan ~1-2 weeks tenant-placement turnaround); 699 units permitted in Kenton County in 2024 (287 in 5+ unit buildings).
- Kenton County population projected at +5% by 2050 — modest demand growth; plan on rents tracking national, not racing it.
- 10 sale attempts since 25y ago with the ask held roughly flat each time — persistent listings suggest the price (not the market) is what's stuck; bring a comps-based counter.
- Current owner paid $37k; list at $225k implies a 508% gain — meaningful room to come down on a strong offer.
- At projected returns (-3.0% appreciation + 5.1% rent growth), your $63k cash investment doubles in ~9 years — after that, you're playing with house money.
- Climate carrying-cost: extreme-heat days projected 7→20/yr by 2055 (HVAC capex compounding) — expect insurance premiums to compound above CPI over the hold.
- Cap rate 9.5% vs local median 5.3% in Covington — top-decile yield for the area; either an underpriced asset or a hidden risk that comps aren't pricing in. Stress-test before assuming the spread holds.
- At $2,478/mo this rent would consume 48% of the median local household income ($61k/yr) (locally 511% of renters already pay >50% of income on rent) — very limited rent-growth headroom before tenants either downsize or default.
Questions for listing agent
- Can we see the unit-by-unit rent roll, current vacancy, and any below-market leases? What's the average tenancy length?
- What capital expenditures (roof, boiler, parking lot, exteriors) have been made in the last 5 years, and what's planned in the next 2?
- Is there a deadline driving the sale (1031 exchange, divorce, estate, relocation)? That informs how much negotiation room exists.
- What's the average days-on-market for RENTAL listings here right now (not sales)? A rising rental-DOM trend means longer vacancies and softer asking-rent achievability than the comps imply.
- What's the recent tenant-quality profile in this submarket — average credit score on applications, eviction rate, late-payment / NSF rate, and stable-employment percentage? A property-management company in the area should have these aggregated.
- How much new apartment / multifamily construction is in the pipeline within 1–3 miles? Heavy new supply (>2% of stock underway) typically softens rents 12–24 months out; light construction supports rent growth.
CashFlowRE · CFR-1021PEBPSKNP0M
· Data 2 weeks ago
cashflowre.app · 2026-05-29