 Duplex
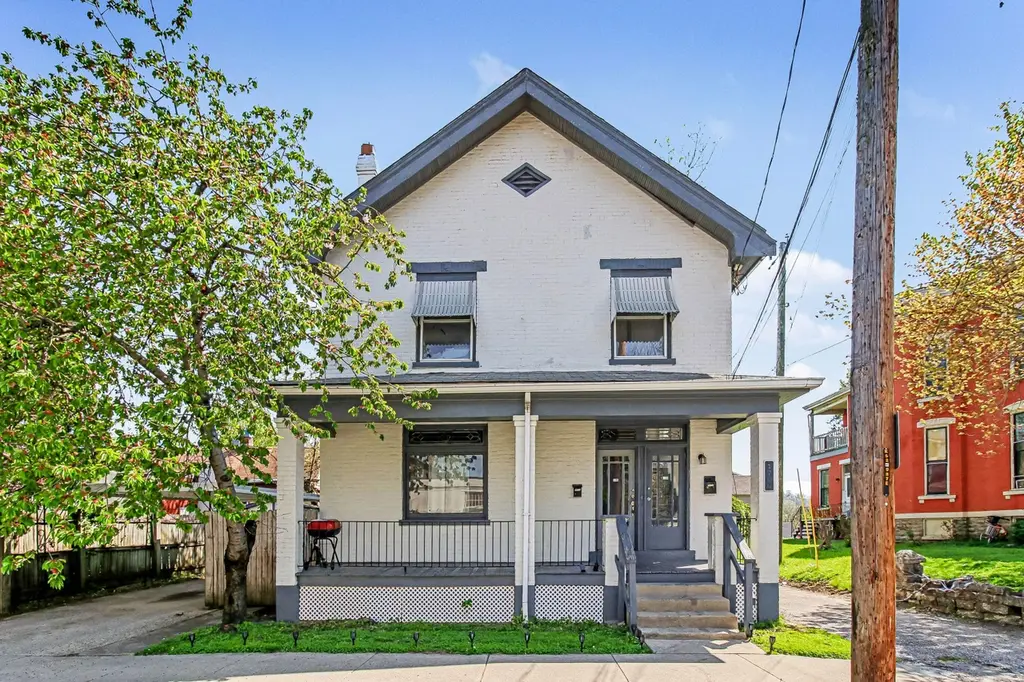
1706 Eastern Ave · Covington, KY
Flood risk 1/10 · Minimal
- FEMA flood zone
- X (unshaded)
- Chance of flooding over 30 yrs
- 0.0%
- Est. flood insurance / yr
- $507 – $1,088
Fire risk 1/10 · Minimal
- Est. fire insurance / yr
- $839 – $1,559
Heat risk 5/10 · Moderate
- Hot days now (above 103°F)
- 7 days/yr
- Hot days in 30 yrs
- 20 days/yr
Wind risk 2/10 · Minimal
- Chance of severe wind over 30 yrs
- 1.0%
Air-quality risk 3/10 · Minor
- Unhealthy air days now
- 2 days/yr
- Unhealthy air days in 30 yrs
- 3 days/yr
Risk factors via First Street. Map © Google.
Why this score? — see what drove the C+ grade
The composite is a weighted blend of 9 inputs, each scored 0–100. Each bar is that input's sub-score; the figure is the points it added to the 100-point composite (weight × sub-score).
- Cash flow +26.6/30.0
- ARV discount +9.9/15.0
- DSCR +9.1/10.0
- 1% rule +6.0/10.0
- Livability +4.3/5.0
- Rent growth +3.8/5.0
- Condition / age +2.5/5.0
- Schools +1.5/10.0
- Appreciation +0.0/10.0
$225,000
🖨 Deal sheet (PDF) 📄 Offer letter ✓ Due diligence
Multi-family units
County records classify this as Multi-Family (2-4 Unit). Listing-text estimate: 2 units. confirmed
Listing remarks
Versatile brick duplex in Covington with strong income potential! Featuring two 1-bedroom, 1-bath units with separate heat and electric. Unit 1 has been recently updated with a tenant on a month to month lease paying $1100 as of 5/1. Unit 2 is move in ready with recent updates of paint, carpet & kitchen. Additional features include covered off-street parking, basement access for the lower unit, and exterior paint completed in 2023. Conveniently located near downtown Covington and Cincinnati, this property is ideal for both investors and owner-occupants to either generate income or offset living expenses.
Key facts
- 2,350 sq ft lot
- Parking
- Listed 10 days
Neighborhood map
What this means for you Summary
Snapshot
- This is a 2 × 1-bed/1.0-bath units multifamily listed at $225k.
Deal economics
- At list price, monthly cash flow is $602 ($7k/yr) — positive. Per door: $301/mo.
- The deal already cash-flows at list — no discount required.
- Meets the 1% rule at list price ($2k rent vs $225k).
- Cap rate 9.5% vs local median 5.3% in Covington — top-decile yield for the area; either an underpriced asset or a hidden risk that comps aren't pricing in. Stress-test before assuming the spread holds.
Location & tenants
- Location reads 86/100 on livability (#40 in KY, #376 nationally) — a professional / high-income tenant draw. Strengths: amenities A+, commute A+, cost of living A+; Watch: employment D+.
- Covington Independent (suburban): math 10% / reading 27% proficiency, ranked #162 of 165 in KY (top 98%) — low school quality limits family demand, transient renter base, plan for 1-2y turnover; 78% free/reduced lunch — lower-income household profile, screen leases tightly.
- Zoned schools: Sixth District Elementary School (math 8% / reading 17%, grade F, #630 of 676 statewide, top 95%, 446 students, 84% FRL); Holmes Middle School (math 8% / reading 26%, grade F, #211 of 217 statewide, top 97%, 656 students, 84% FRL); Holmes High School (math 12% / reading 17%, grade F, #227 of 254 statewide, top 89%, 878 students, 80% FRL) — zoned schools at 83% FRL track the district average.
- Market conditions: Rents rising fast (+5.1%/yr); 59 active listings in the ZIP; 5 comparable units currently listed for rent nearby; rentals leasing fast (median 8d on market — plan ~1-2 weeks tenant-placement turnaround); 699 units permitted in Kenton County in 2024 (287 in 5+ unit buildings).
- At $2,478/mo this rent would consume 48% of the median local household income ($61k/yr) (locally 511% of renters already pay >50% of income on rent) — very limited rent-growth headroom before tenants either downsize or default.
Forward outlook
- Local home prices are declining (-3.0%/yr); year-one equity from $2k of loan paydown is wiped out by about $7k of value loss. Plan a longer hold.
- Kenton County population projected at +5% by 2050 — modest demand growth; plan on rents tracking national, not racing it.
- At projected returns (-3.0% appreciation + 5.1% rent growth), your $63k cash investment doubles in ~9 years — after that, you're playing with house money.
Negotiation context
- Only 10 days on market — expect competitive offers; lowballing is unlikely to land.
- 10 sale attempts since 25y ago with the ask held roughly flat each time — persistent listings suggest the price (not the market) is what's stuck; bring a comps-based counter.
- Current owner paid $37k; list at $225k implies a 508% gain — meaningful room to come down on a strong offer.
Risks & watch-outs
- Climate carrying-cost: extreme-heat days projected 7→20/yr by 2055 (HVAC capex compounding) — expect insurance premiums to compound above CPI over the hold.
Questions for the listing agent
- Can we see the unit-by-unit rent roll, current vacancy, and any below-market leases? What's the average tenancy length?
- What capital expenditures (roof, boiler, parking lot, exteriors) have been made in the last 5 years, and what's planned in the next 2?
- Is there a deadline driving the sale (1031 exchange, divorce, estate, relocation)? That informs how much negotiation room exists.
- What's the average days-on-market for RENTAL listings here right now (not sales)? A rising rental-DOM trend means longer vacancies and softer asking-rent achievability than the comps imply.
- What's the recent tenant-quality profile in this submarket — average credit score on applications, eviction rate, late-payment / NSF rate, and stable-employment percentage? A property-management company in the area should have these aggregated.
- How much new apartment / multifamily construction is in the pipeline within 1–3 miles? Heavy new supply (>2% of stock underway) typically softens rents 12–24 months out; light construction supports rent growth.
Investment metrics
- 1% rule
- 1.10% ✓
- Cap rate
- 9.51%
- Cash-on-cash
- 11.47%
- DSCR
- 1.51
- GRM
- 7.6
CMA / ARV
- ARV (on-the-fly)
- $237,666
- Comps found
- 5
Show comp detail 5 sales within ~0.75 mi
| Address | Dist | Beds/Ba | Sqft | Sold | Price | $/sf | Match |
|---|---|---|---|---|---|---|---|
| 10 Widrig St | 0.54mi | 4/2.5 | 1,716 (+3%) | 3mo | $265,000 | $154 | 65 |
| 503 W 13th St | 0.57mi | 4/2.0 | 1,577 (-5%) | 7mo | $266,000 | $169 | 59 |
| 16 Martin St | 0.53mi | 4/4.0 | 1,628 (-2%) | 8mo | $220,000 | $135 | 57 |
| 121 Trevor St | 0.58mi | 3/2.0 (-1) | 1,831 (+10%) | 13mo | $170,000 | $93 | 40 |
| 202 Levassor Ave | 0.72mi | 5/3.0 (+1) | 1,806 (+9%) | 13mo | $258,000 | $143 | 33 |
Match score weights: distance 35% · size 25% · config 20% · recency 20%. Top-matched comps best support the ARV.
Projected returns pro-forma
-3.0% appreciation · 5.13% rent growth · sell at horizon
- IRR
- 2.9%
- Equity multiple
- 1.11×
- Total profit
- $7,243
- Equity at exit
- $33,548
- IRR
- 14.2%
- Equity multiple
- 2.25×
- Total profit
- $78,608
- Equity at exit
- $19,454
Cash invested: $63,000 (down + closing). Projections, not guarantees.
Landlord ↔ Tenant lean methodology
- Overall (STATE)
- 83 Strongly Landlord-Friendly
- State Kentucky
- 83 Strongly Landlord-Friendly · R+16
- County
- — inherits STATE
- City
- — inherits STATE
ZIP-level market 41014
- Rents YoY
- 5.1%
- Active inventory
- 59
- Price-to-rent
- 15.1×
Monthly cashflow live
- Estimated rent
- $2,478 high interval (Pro) →
- Mortgage (P&I)
- −$1,180
- Tax from tax record
- −$82 /mo · $979/yr
- Insurance
- −$94
- HOA
- −$0
- Vacancy / Maint / Mgmt
- −$520
- Net cashflow
- $602
Break-even live
Sensitivity live
| Price | -10% $730 | -5% $666 | +0% $602 | +5% $539 | +10% $475 |
|---|---|---|---|---|---|
| Rent | -10% $407 | -5% $504 | +0% $602 | +5% $700 | +10% $798 |
| Rate | -1.0pp $716 | -0.5pp $660 | base $602 | +0.5pp $544 | +1.0pp $485 |
2-unit breakdown (identical units grouped — click to expand)
| Units | Beds | Baths | Est. rent |
|---|---|---|---|
| 2× units | 1 | 1 | $2,478 |
| #1 | 1 | 1 | $1,239 |
| #2 | 1 | 1 | $1,239 |
| Total (2 units) | $2,478 | ||
UW: 25.0% down · 7.5% · 30yr · 1.5% tax · 5.0% vac · 8.0% maint · 8.0% mgmt
Financing live
Cash to close
- Down payment
- $56,250
- Closing costs
- $6,750
- Reserves months
- —
- Total cash needed
- —
Loan-product check · same deal, 3 products live
Conventional
25% down · 7.5% · 30yr
- Down + closing
- —
- Monthly P&I
- —
- Monthly cashflow
- —
- DSCR
- —
- Eligible?
- —
Personal DTI + credit; lowest rate.
DSCR
20% down · 8.5% · 30yr
- Down + closing
- —
- Monthly P&I
- —
- Monthly cashflow
- —
- DSCR
- —
- Eligible?
- —
No personal income docs; deal must DSCR.
Hard money
10% down · 12.0% · 12mo
- Down + closing
- —
- Monthly P&I
- —
- Monthly cashflow
- —
- DSCR
- —
- Eligible?
- —
Short-term bridge; refi at stabilization.
Rent comps 5 comps
| Address | Beds | Baths | Sqft | Rent | $/sqft | DOM | Units | Dist |
|---|---|---|---|---|---|---|---|---|
| 2030 Mackoy St Covington, KY | 3.0 | 1.5 | 1598 | $1,779 | $1.11 | 5d | 1 | 0.37mi |
| 1927 Scott St Apt 1 Covington, KY | 3.0 | 2.0 | 1865 | $2,100 | $1.13 | 20d | 1 | 0.43mi |
| 1700 Aspen Pines Dr Wilder, KY | 1.0–3.0 | 1.0–2.5 | 1420 | $2,365 | $1.67 | 2d | 14 | 0.95mi |
| 2307 Center St Covington, KY | 3.0 | 1.5 | 1216 | $1,950 | $1.60 | 8d | 1 | 0.98mi |
| 1205 Lee St Unit 3 Covington, KY | 3.0 | 2.5 | 1850 | $3,000 | $1.62 | 24d | 1 | 1.01mi |
Listing history 28 events
-
2026-04-20status Pending
-
2026-04-10$225,000 Active
-
2025-07-28status Pending
-
2025-07-26historical
-
2025-07-15price $180,000
-
2025-07-11price $185,000
-
2025-06-13price $190,000
-
2025-05-27$200,000 Active
-
2024-12-19historical
-
2024-10-28$179,900 Active
-
2024-10-28historical
-
2024-08-12$212,000 Active
-
2017-04-07soldstatus $37,000
-
2016-03-22$44,000
-
2016-03-04historical
-
2015-11-30$84,900
-
2012-11-30historical
-
2012-03-27$50,000
-
2004-07-15soldstatus $63,500
-
2002-04-09soldstatus $61,500
-
2002-04-02soldstatus $61,500
-
2002-01-21$66,500
-
2001-11-24historical
-
2001-08-24$69,900
-
2001-06-30historical
-
2001-01-10$74,900
-
1992-12-30soldstatus $45,000
-
1987-12-11soldstatus $39,000
ⓘ Source: listings_history table (triggers on properties + properties_extension) + one-shot
backfill from property_details.listing_events for pre-trigger history.
Tax reassessment forecast KY · Resets to sale price
- Current annual tax
- $979 · $82/mo
- Projected year-2 tax
- $1,935 · $161/mo
- Expected delta
- +$956/yr (+$80/mo · 97.7%)
ⓘ Screening estimate from a state-policy table — verify with the county assessor before closing.
Climate risk First Street
- Flood 1/10 Low FEMA zone X (unshaded) · 0% chance over 30 yrs
- Wildfire 1/10 Low
- Heat 5/10 Major 7 d/yr ≥103°F today · 20 d/yr by 30 yrs out
- Wind 2/10 Low 100% chance of damaging wind over 30 yrs
- Air quality 3/10 Moderate 2 unhealthy d/yr today · 3 by 30 yrs out
Nearby sold comps map
Loading sold comps map…
Walkable amenities ~0.75 mi
Loading nearby amenities…
Taxation est. · year 1
- Rental income
- $29,736
- − Mortgage interest
- −$12,603
- − Property taxes
- −$979
- − Insurance
- −$1,125
- − Repairs & maintenance
- −$2,379
- − Management
- −$2,379
- − Depreciation
- −$6,545
- Taxable income
- $3,725
- Est. tax owed @ 24.0%
- −$894
- After-tax cash flow
- $6,334/yr
For passive investors: Depreciation is non-cash, so a rental often shows a tax loss while cash-flowing — sheltering income. Rental losses are passive: they offset passive income freely, and up to $25,000/yr can offset ordinary (W-2) income if you actively participate and your MAGI is under $100k (phasing out to $0 by $150k); unused losses carry forward. On sale, claimed depreciation is recaptured at up to 25%, and gains may owe capital-gains tax (a 1031 exchange can defer both). Figures are a year-1 estimate at your 24.0% rate — not tax advice; consult a CPA.
Schools (NCES district)
- District
- Covington Independent
- NCES district ID
- 2101350
- Math proficiency
- 10% ▼ -20.00%
- Reading proficiency
- 27% ▼ -14.00%
- Median HH income
- $33,681
- Composite
- 15.04/100
- National rank
- #9353
- State rank
- #162 of 165 in KY
Livability — Covington
- Score
- 86/100
- State rank
- #40
- US rank
- #376
Category grades
Schools grade is shown separately in the Schools card above.
Census & demographics
- Census place
- Covington, KY
- County
- Kenton County · 142,881 people
- City population
- 34,373
- Metro
- Cincinnati, OH-KY-IN
- Population (ZIP)
- 7,392
- Household income
- $61,382
- Rent vs Own
- Severe rent burden
- 511.0
Population outlook (Kenton County) Hauer SSP2
- Today (2025)
- 174,205 people
- By 2030
- 177,897 · +2.1%
- By 2040
- 182,671 · +4.9%
- By 2050
- 183,543 · +5.4%
- By 2075
- 178,977 · +2.7%
- By 2100
- 159,920 · -8.2%
Race, ethnicity, and origin ACS 2023
- Neighborhood character
- Predominantly White (71%)
- Race & ethnicity
- White 71% Two or more races 11% Hispanic / Latino 10% Black 8% Asian 2%
- Hispanic origin (detail)
- Mexican 1%
- Common ancestry
- Romanian 2% Lithuanian 1% Italian 1%
- Foreign-born
- 6% · Canada, China
- Languages at home
- 91% English-only · Spanish 8%
Political lean MEDSL · Kenton
- 2024 margin
- Strong R (+21.7) · D 38.2% · R 59.9% · Other 1.9%
- 2008→2024 swing
- -0.9pp no change · 2008: -20.9pp · 2024: -21.7pp
- All cycles
- 2024: R+21.7 2020: R+19.3 2016: R+26.1 2012: R+24.3 2008: R+20.9
Not yet ingested
- Civics
- —
Market trends
- HPI YoY
- ▼ -172.77%
- Current HPI
- 233.8216
- Rent YoY
- ▲ 5.13%
- Metro
- Cincinnati, OH-KY-IN
- State GDP YoY
- ▲ 1.81%
- F500 in state
- 4
Industry mix (Fortune 500 HQ in KY)
| Industry | F500 HQs | Revenue |
|---|---|---|
| Healthcare | 1 | $118B |
|
||
| Food / Beverage | 1 | $7B |
|
||
Price history
+476.9% since first listed28 events — show timeline
- 2026-04-20 Pending — NKMLS
- 2026-04-10 Listed $225,000 NKMLS
- 2025-07-28 Pending — NKMLS
- 2025-07-26 Listing Removed — NKMLS
- 2025-07-15 Price Changed $180,000 NKMLS
- 2025-07-11 Price Changed $185,000 NKMLS
- 2025-06-13 Price Changed $190,000 NKMLS
- 2025-05-27 Listed $200,000 NKMLS
- 2024-12-19 Listing Removed — NKMLS
- 2024-10-28 Listing Removed — NKMLS
- 2024-10-28 Listed $179,900 NKMLS
- 2024-08-12 Listed $212,000 NKMLS
- 2017-04-07 Sold (MLS) $37,000 NKMLS
- 2016-03-22 Listed $44,000 NKMLS
- 2016-03-04 Listing Removed — NKMLS
- 2015-11-30 Listed $84,900 NKMLS
- 2012-11-30 Listing Removed — NKMLS
- 2012-03-27 Listed $50,000 NKMLS
- 2004-07-15 Sold (Public Records) $63,500 Public Records
- 2002-04-09 Sold (Public Records) $61,500 Public Records
- 2002-04-02 Sold (MLS) $61,500 NKMLS
- 2002-01-21 Listed $66,500 NKMLS
- 2001-11-24 Listing Removed — NKMLS
- 2001-08-24 Listed $69,900 NKMLS
- 2001-06-30 Listing Removed — NKMLS
- 2001-01-10 Listed $74,900 NKMLS
- 1992-12-30 Sold (Public Records) $45,000 Public Records
- 1987-12-11 Sold (Public Records) $39,000 Public Records
Property tax history
-1.5%/yrLatest (2025): $979 · +0.7% YoY. Source: county tax records.
Cash-flow waterfall
monthlySold comps — $/sqft
last 12 mo · ≤1 miLoading sold comps…