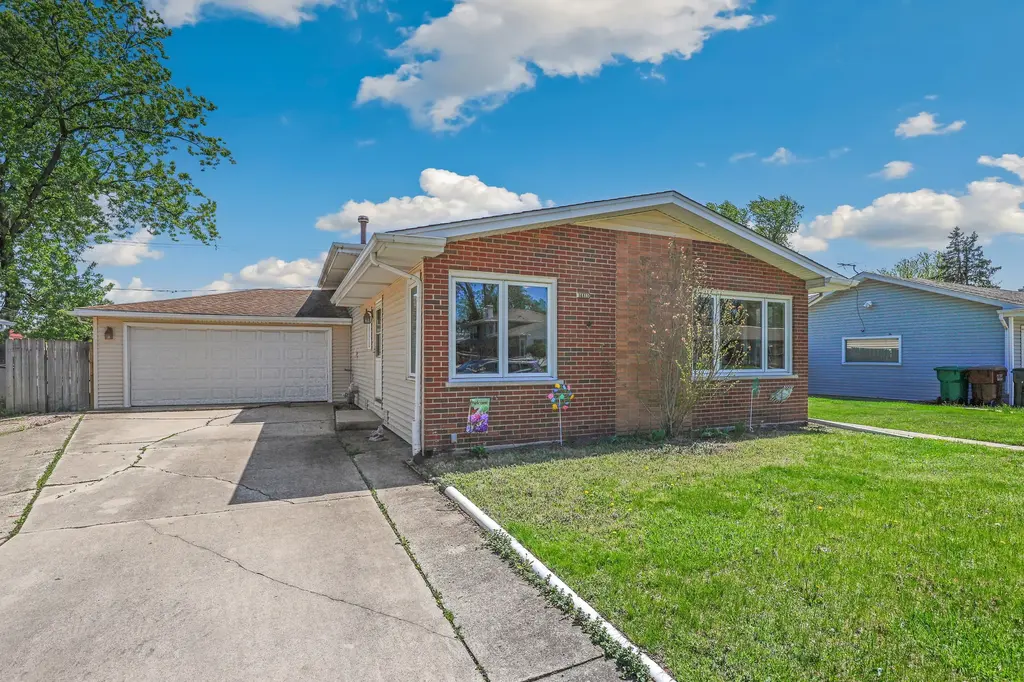
16813 Oconto Ave
Tinley Park, IL 60477
$285,000D
3 bd · 1.5 ba ·
1,214 sqft ·
Built 1960
· SingleFamily
· Pending
· 3 DOM
Cashflow @ list (25.0% down · 7.5%)
Estimated rent
$2,552/mo
Mortgage (P&I)
−$1,495
Tax + insurance
−$620
HOA
−$0
Vac / Maint / Mgmt
−$536
Net cashflow
$-99/mo
Annual
$-1,183/yr
Cap rate
5.88%
Cash-on-cash
-1.48%
DSCR
0.93
1% rule
0.90%
Cash to close
$79,800
Investor read
- This is a 3-bed/1.5-bath single-family listed at $285k.
- At list price, monthly cash flow is $-99 ($-1k/yr) — negative.
- To cash-flow at today's rent, offer at most $268k (6.1% below list).
- To meet the 1% rule (rent ≥ 1% of price), the offer needs to be $255k (10.4% below list).
- Only 3 days on market — expect competitive offers; lowballing is unlikely to land.
- Recommended offer: $255k (10.4% below list) — sets the bar for 1% rule.
- Local home prices are declining (-3.0%/yr); year-one equity from $2k of loan paydown is wiped out by about $9k of value loss. Plan a longer hold.
- Location reads 74/100 on livability (#246 in IL, #4,453 nationally) — a middle-class / working-renter tenant base. Strengths: commute A+, employment A+, housing A+; Watch: amenities F, health & safety F.
- Cons Hsd 230 (suburban): math 35% / reading 39% proficiency, ranked #146 of 620 in IL (top 24%) — families likely to look elsewhere, expect single-tenant / working-renter base with shorter leases.
- Zoned schools: John A Bannes Elem School (math 37% / reading 27%, grade F, #586 of 2,056 statewide, top 31%, 454 students, 0% FRL); Virgil I Grissom Middle School (math 41% / reading 46%, grade D, #101 of 665 statewide, top 16%, 596 students, 0% FRL); Victor J Andrew High School (math 32% / reading 36%, grade F, #147 of 693 statewide, top 22%, 2,259 students, 0% FRL).
- Market conditions: 159 active listings in the ZIP; 7 comparable units currently listed for rent nearby; rentals leasing fast (median 1d on market — plan ~1-2 weeks tenant-placement turnaround); solid renter incomes; 6,272 units permitted in Cook County in 2024 (4,658 in 5+ unit buildings).
- Current owner paid $145k; list at $285k implies a 97% gain — meaningful room to come down on a strong offer.
- Cap rate 5.9% vs local median 4.3% in Tinley Park — top-decile yield for the area; either an underpriced asset or a hidden risk that comps aren't pricing in. Stress-test before assuming the spread holds.
- This rent runs 32% of the median local income ($95k/yr) — at the standard rent-burdened threshold; future hikes will face affordability resistance.
Questions for listing agent
- What do current leases actually rent for vs. the listed asking? Can we see a recent rent roll and the last 12 months of T-12 income?
- Built in 1960 — when were the roof, HVAC, electrical panel, plumbing, and water heater last replaced?
- Is there a deadline driving the sale (1031 exchange, divorce, estate, relocation)? That informs how much negotiation room exists.
- The area grade is low — what's the realistic commute time and amenity access for the typical tenant pool here? Any planned neighborhood developments (good or bad) we should know about?
- What's the average days-on-market for RENTAL listings here right now (not sales)? A rising rental-DOM trend means longer vacancies and softer asking-rent achievability than the comps imply.
- What's the recent tenant-quality profile in this submarket — average credit score on applications, eviction rate, late-payment / NSF rate, and stable-employment percentage? A property-management company in the area should have these aggregated.
- How much new for-sale + rental construction is in the pipeline within 1–3 miles? Heavy new supply typically softens prices + rents 12–24 months out; constrained supply supports both.
CashFlowRE · CFR-10JCX46H02N4XM
· Data 4 weeks ago
cashflowre.app · 2026-05-29