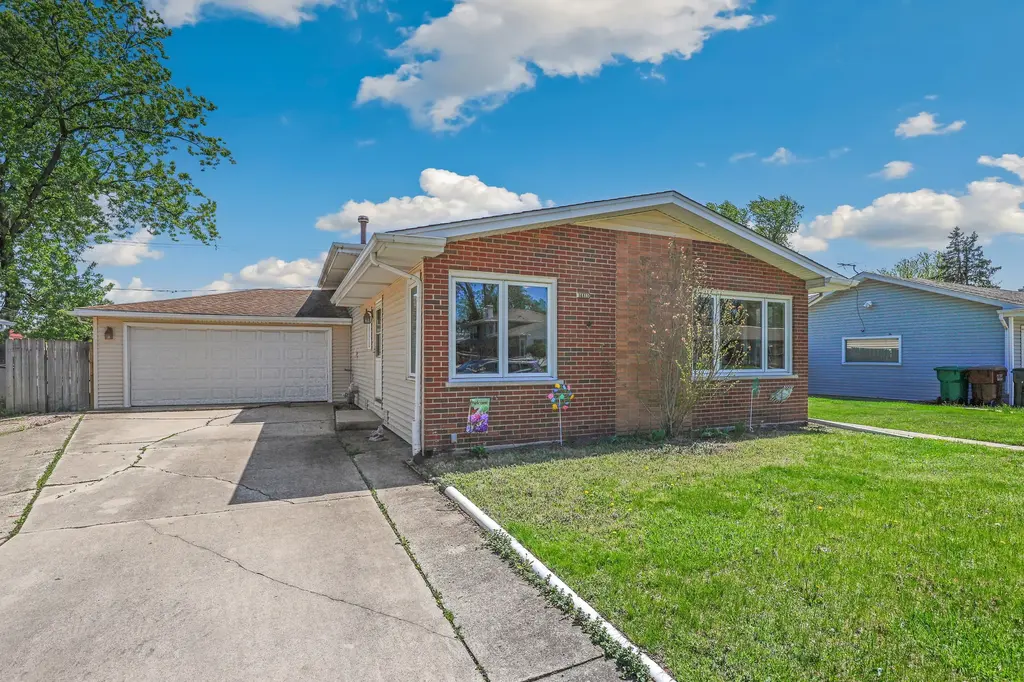
16813 Oconto Ave · Tinley Park, IL
Flood risk 1/10 · Minimal
- FEMA flood zone
- X (unshaded)
- Chance of flooding over 30 yrs
- 0.0%
- Est. flood insurance / yr
- $473 – $860
Fire risk 1/10 · Minimal
- Est. fire insurance / yr
- $804 – $1,492
Heat risk 3/10 · Minor
- Hot days now (above 101°F)
- 7 days/yr
- Hot days in 30 yrs
- 15 days/yr
Wind risk 2/10 · Minimal
- Chance of severe wind over 30 yrs
- —
Air-quality risk 4/10 · Minor
- Unhealthy air days now
- 4 days/yr
- Unhealthy air days in 30 yrs
- 5 days/yr
Risk factors via First Street. Map © Google.
Why this score? — see what drove the D grade
The composite is a weighted blend of 9 inputs, each scored 0–100. Each bar is that input's sub-score; the figure is the points it added to the 100-point composite (weight × sub-score).
- ARV discount +13.2/15.0
- Cash flow +11.8/30.0
- 1% rule +4.0/10.0
- Livability +3.7/5.0
- DSCR +3.5/10.0
- Schools +3.4/10.0
- Rent growth +2.5/5.0
- Condition / age +2.5/5.0
- Appreciation +0.0/10.0
$285,000
🖨 Deal sheet (PDF) 📄 Offer letter ✓ Due diligence
Listing remarks
Welcome home to this beautifully maintained tri-level home in the heart of Tinley Park! The inviting entry opens into bright, open concept living and dining spaces featuring gleaming hardwood floors throughout. The sunny kitchen offers ample cabinet storage, a breakfast bar, and easy access to the side yard, making everyday living and entertaining effortless. Upstairs you will find three spacious bedrooms, all with hardwood flooring, along with a full bath. The lower level provides additional living space with a comfortable family room, a convenient half bath, and a dedicated laundry area, plus extra storage. Step outside to enjoy the stone patio, perfect for relaxing or grilling, overlook
Key facts
- 7,840 sq ft lot
- 2 garage spots
- Pool
Property features AI
Finance
- Other: Property not currently leased; Some photos are virtually staged
- HOA & community: No master association fee required; Community features include park, curbs, sidewalks, street lights, and paved streets
Exterior
- Parking: Detached garage owned (garage door opener); Concrete parking; 2 garage spaces; 2 total parking spaces
- Security: Carbon monoxide detectors; Ceiling fans
- Utilities: Water from Lake Michigan; Public sewer; Electric service with circuit breakers
- Home design: Detached single-family home; Tri-level / Split-level layout; Estimated living area; Fee simple ownership; Located in a historical district; near commuter train and interstate access; school bus service
- Construction: Built approximately 61–70 years ago; Vinyl siding and brick exterior; Asphalt roof; Built before 1978
- Exterior features: Above-ground pool; Deck
Interior
- Kitchen: Country-style kitchen (12 x 10) with ceramic tile flooring; Range; Microwave; Dishwasher; Refrigerator
- Bedrooms: Master bedroom on second level (13 x 11) with hardwood floors; Second bedroom on second level (11 x 13) with hardwood floors; Third bedroom on second level (10 x 10) with hardwood floors
- Flooring: Hardwood flooring in living areas and bedrooms; Ceramic tile in kitchen; Vinyl flooring in lower-level rooms
- Bathrooms: 1 full bathroom; 1 half bathroom; Basement bathroom present
- Heating & cooling: Natural gas forced-air heating; Central air conditioning; Circuit breaker electrical service
- Interior features: Storm door(s); Window screens; Unfinished attic; Finished partial basement with crawl space; 7 total rooms
- Laundry & utility: Lower-level laundry (13 x 8) with vinyl flooring; Gas dryer hookup; Laundry sink; Humidifier
Neighborhood map
What this means for you Summary
Snapshot
- This is a 3-bed/1.5-bath single-family listed at $285k.
Deal economics
- At list price, monthly cash flow is $-79 ($-949/yr) — negative.
- To cash-flow at today's rent, offer at most $271k (4.9% below list).
- To meet the 1% rule (rent ≥ 1% of price), the offer needs to be $258k (9.6% below list).
- Recommended offer: $258k (9.6% below list) — sets the bar for 1% rule.
- Cap rate 6.0% vs local median 4.3% in Tinley Park — top-decile yield for the area; either an underpriced asset or a hidden risk that comps aren't pricing in. Stress-test before assuming the spread holds.
Location & tenants
- Location reads 74/100 on livability (#246 in IL, #4,453 nationally) — a middle-class / working-renter tenant base. Strengths: commute A+, employment A+, housing A+; Watch: amenities F, health & safety F.
- Cons Hsd 230 (suburban): math 35% / reading 39% proficiency, ranked #146 of 620 in IL (top 24%) — families likely to look elsewhere, expect single-tenant / working-renter base with shorter leases.
- Zoned schools: John A Bannes Elem School (math 37% / reading 27%, grade F, #586 of 2,056 statewide, top 31%, 454 students, 0% FRL); Virgil I Grissom Middle School (math 41% / reading 46%, grade D, #101 of 665 statewide, top 16%, 596 students, 0% FRL); Victor J Andrew High School (math 32% / reading 36%, grade F, #147 of 693 statewide, top 22%, 2,259 students, 0% FRL).
- Market conditions: 159 active listings in the ZIP; 6 comparable units currently listed for rent nearby; rentals leasing fast (median 4d on market — plan ~1-2 weeks tenant-placement turnaround); solid renter incomes; 6,272 units permitted in Cook County in 2024 (4,658 in 5+ unit buildings).
- This rent runs 33% of the median local income ($95k/yr) — at the standard rent-burdened threshold; future hikes will face affordability resistance.
Forward outlook
- Local home prices are declining (-3.0%/yr); year-one equity from $2k of loan paydown is wiped out by about $9k of value loss. Plan a longer hold.
Negotiation context
- Only 3 days on market — expect competitive offers; lowballing is unlikely to land.
- Current owner paid $145k; list at $285k implies a 97% gain — meaningful room to come down on a strong offer.
Questions for the listing agent
- What do current leases actually rent for vs. the listed asking? Can we see a recent rent roll and the last 12 months of T-12 income?
- Built in 1960 — when were the roof, HVAC, electrical panel, plumbing, and water heater last replaced?
- Is there a deadline driving the sale (1031 exchange, divorce, estate, relocation)? That informs how much negotiation room exists.
- The area grade is low — what's the realistic commute time and amenity access for the typical tenant pool here? Any planned neighborhood developments (good or bad) we should know about?
- What's the average days-on-market for RENTAL listings here right now (not sales)? A rising rental-DOM trend means longer vacancies and softer asking-rent achievability than the comps imply.
- What's the recent tenant-quality profile in this submarket — average credit score on applications, eviction rate, late-payment / NSF rate, and stable-employment percentage? A property-management company in the area should have these aggregated.
- How much new for-sale + rental construction is in the pipeline within 1–3 miles? Heavy new supply typically softens prices + rents 12–24 months out; constrained supply supports both.
Investment metrics
- 1% rule
- 0.90% ✗
- Cap rate
- 5.96%
- Cash-on-cash
- -1.19%
- DSCR
- 0.95
- GRM
- 9.2
CMA / ARV
- ARV (on-the-fly)
- $326,566
- Comps found
- 12
Show comp detail 12 sales within ~0.75 mi
| Address | Dist | Beds/Ba | Sqft | Sold | Price | $/sf | Match |
|---|---|---|---|---|---|---|---|
| 6901 167th St | 0.42mi | 3/1.0 | 1,128 (-7%) | 1mo | $269,900 | $239 | 66 |
| 16719 Olcott Ave | 0.22mi | 3/2.0 | 1,095 (-10%) | 10mo | $350,000 | $320 | 63 |
| 7513 Dorothy Ln | 0.27mi | 3/2.0 | 1,095 (-10%) | 9mo | $380,000 | $347 | 62 |
| 7444 Nottingham Dr | 0.63mi | 3/2.0 | 1,218 (+0%) | 9mo | $335,000 | $275 | 60 |
| 17209 70th Ave | 0.59mi | 3/1.5 | 1,264 (+4%) | 9mo | $349,999 | $277 | 58 |
| 6721 165th Pl | 0.69mi | 3/1.5 | 1,131 (-7%) | 0mo | $300,000 | $265 | 56 |
| 6666 Ravinia Dr | 0.67mi | 3/1.0 | 1,137 (-6%) | 4mo | $285,000 | $251 | 53 |
| 17157 69th Ave | 0.61mi | 4/2.0 (+1) | 1,169 (-4%) | 9mo | $314,900 | $269 | 51 |
| 17223 69th Ave | 0.65mi | 3/2.0 | 1,304 (+7%) | 7mo | $295,000 | $226 | 49 |
| 16957 Sayre Ave | 0.38mi | 3/3.0 | 1,376 (+13%) | 7mo | $300,000 | $218 | 48 |
| 7278 173rd Pl | 0.65mi | 3/2.0 | 1,109 (-9%) | 6mo | $349,900 | $316 | 48 |
| 17212 Harlem Ave | 0.51mi | 4/2.5 (+1) | 1,300 (+7%) | 9mo | $286,000 | $220 | 48 |
Match score weights: distance 35% · size 25% · config 20% · recency 20%. Top-matched comps best support the ARV.
Projected returns pro-forma
-3.0% appreciation · 3.0% rent growth · sell at horizon
- IRR
- -18.2%
- Equity multiple
- 0.36×
- Total profit
- $-51,092
- Equity at exit
- $42,494
- IRR
- -10.4%
- Equity multiple
- 0.37×
- Total profit
- $-50,457
- Equity at exit
- $24,642
Cash invested: $79,800 (down + closing). Projections, not guarantees.
Landlord ↔ Tenant lean methodology
- Overall (STATE)
- 43 Moderately Tenant-Leaning
- State Illinois
- 43 Moderately Tenant-Leaning · D+7
- County
- — inherits STATE
- City
- — inherits STATE
ZIP-level market 60477
- Active inventory
- 159
- Price-to-rent
- 9.2×
Monthly cashflow live
- Estimated rent
- $2,577 high interval (Pro) →
- Mortgage (P&I)
- −$1,495
- Tax from tax record
- −$502 /mo · $6,020/yr
- Insurance
- −$119
- HOA
- −$0
- Vacancy / Maint / Mgmt
- −$541
- Net cashflow
- $-79
Break-even live
Sensitivity live
| Price | -10% $82 | -5% $2 | +0% $-79 | +5% $-160 | +10% $-240 |
|---|---|---|---|---|---|
| Rent | -10% $-283 | -5% $-181 | +0% $-79 | +5% $23 | +10% $124 |
| Rate | -1.0pp $64 | -0.5pp $-7 | base $-79 | +0.5pp $-153 | +1.0pp $-228 |
UW: 25.0% down · 7.5% · 30yr · 1.5% tax · 5.0% vac · 8.0% maint · 8.0% mgmt
Financing live
Cash to close
- Down payment
- $71,250
- Closing costs
- $8,550
- Reserves months
- —
- Total cash needed
- —
Loan-product check · same deal, 3 products live
Conventional
25% down · 7.5% · 30yr
- Down + closing
- —
- Monthly P&I
- —
- Monthly cashflow
- —
- DSCR
- —
- Eligible?
- —
Personal DTI + credit; lowest rate.
DSCR
20% down · 8.5% · 30yr
- Down + closing
- —
- Monthly P&I
- —
- Monthly cashflow
- —
- DSCR
- —
- Eligible?
- —
No personal income docs; deal must DSCR.
Hard money
10% down · 12.0% · 12mo
- Down + closing
- —
- Monthly P&I
- —
- Monthly cashflow
- —
- DSCR
- —
- Eligible?
- —
Short-term bridge; refi at stabilization.
Rent comps 6 comps
| Address | Beds | Baths | Sqft | Rent | $/sqft | DOM | Units | Dist |
|---|---|---|---|---|---|---|---|---|
| 16851 Harlem Ave Tinley Park, IL | 1.0–2.0 | 1.0–2.0 | 857 | $3,065 | $3.58 | 0d | 24 | 0.20mi |
| 6661 Glenview Dr Tinley Park, IL | 3.0 | 2.0 | 1125 | $3,200 | $2.84 | 0d | 1 | 0.68mi |
| 17212 Oak Park Ave Unit 2SE Tinley Park, IL | 2.0 | 2.0 | 1200 | $2,600 | $2.17 | 12d | 1 | 0.74mi |
| 17385 70th Ave Apt I Tinley Park, IL | 2.0 | 1.0 | 900 | $1,350 | $1.50 | 18d | 1 | 0.86mi |
| 17537 70th Ct Tinley Park, IL | 3.0 | 1.5 | 1170 | $3,000 | $2.56 | 0d | 1 | 1.00mi |
| 17545 71st Ave Tinley Park, IL | 3.0 | 1.5 | 1144 | $1,800 | $1.57 | 3d | 1 | 1.03mi |
Listing history 5 events
-
2026-05-04status Pending
-
2026-05-01$285,000 Active
-
1999-09-21soldstatus $145,000
-
1991-11-29soldstatus $115,000
-
1977-03-15soldstatus $48,000
ⓘ Source: listings_history table (triggers on properties + properties_extension) + one-shot
backfill from property_details.listing_events for pre-trigger history.
Tax reassessment forecast IL · Partial reset (capped growth)
- Current annual tax
- $6,020 · $502/mo
- Projected year-2 tax
- $6,245 · $520/mo
- Expected delta
- +$225/yr (+$19/mo · 3.7%)
ⓘ Screening estimate from a state-policy table — verify with the county assessor before closing.
Climate risk First Street
- Flood 1/10 Low FEMA zone X (unshaded) · 0% chance over 30 yrs
- Wildfire 1/10 Low
- Heat 3/10 Moderate 7 d/yr ≥101°F today · 15 d/yr by 30 yrs out
- Wind 2/10 Low
- Air quality 4/10 Moderate 4 unhealthy d/yr today · 5 by 30 yrs out
Nearby sold comps map
Loading sold comps map…
Walkable amenities ~0.75 mi
Loading nearby amenities…
Taxation est. · year 1
- Rental income
- $30,925
- − Mortgage interest
- −$15,964
- − Property taxes
- −$6,020
- − Insurance
- −$1,425
- − Repairs & maintenance
- −$2,474
- − Management
- −$2,474
- − Depreciation
- −$8,291
- Taxable loss
- −$5,724
- Est. tax savings @ 24.0%
- +$1,374
- After-tax cash flow
- $424/yr
For passive investors: Depreciation is non-cash, so a rental often shows a tax loss while cash-flowing — sheltering income. Rental losses are passive: they offset passive income freely, and up to $25,000/yr can offset ordinary (W-2) income if you actively participate and your MAGI is under $100k (phasing out to $0 by $150k); unused losses carry forward. On sale, claimed depreciation is recaptured at up to 25%, and gains may owe capital-gains tax (a 1031 exchange can defer both). Figures are a year-1 estimate at your 24.0% rate — not tax advice; consult a CPA.
Schools (NCES district)
- District
- Cons Hsd 230
- NCES district ID
- 1708400
- Math proficiency
- 35% ▼ -8.00%
- Reading proficiency
- 39% ▼ -6.00%
- Median HH income
- $73,953
- Composite
- 34.29/100
- National rank
- #5244
- State rank
- #146 of 620 in IL
Livability — Tinley Park
- Score
- 74/100
- State rank
- #246
- US rank
- #4453
Category grades
Schools grade is shown separately in the Schools card above.
Census & demographics
- Census place
- Tinley Park, IL
- County
- Cook County · 4,486,803 people
- City population
- 35,976
- Metro
- Chicago-Naperville-Elgin, IL-IN-WI
- Population (ZIP)
- 35,976
- Household income
- $94,927
- Rent vs Own
- Severe rent burden
- 753.0
Population outlook (Cook County) Hauer SSP2
- Today (2025)
- 5,347,519 people
- By 2030
- 5,357,703 · +0.2%
- By 2040
- 5,324,924 · -0.4%
- By 2050
- 5,230,762 · -2.2%
- By 2075
- 4,785,735 · -10.5%
- By 2100
- 4,188,836 · -21.7%
Race, ethnicity, and origin ACS 2023
- Neighborhood character
- Predominantly White (74%)
- Race & ethnicity
- White 74% Hispanic / Latino 12% Two or more races 9% Black 7% Asian 3%
- Hispanic origin (detail)
- Mexican 9% Puerto Rican 2%
- Common ancestry
- Romanian 14% Iranian 3% Lithuanian 2%
- Foreign-born
- 9% · Canada, China
- Languages at home
- 85% English-only · Spanish 6% Arabic 5% Other Indo-European 1%
Political lean MEDSL · Cook
- 2024 margin
- Solid D (+42.0) · D 70.4% · R 28.4% · Other 1.2%
- 2008→2024 swing
- -11.4pp toward R · 2008: 53.4pp · 2024: 42.0pp
- All cycles
- 2024: D+42.0 2020: D+50.3 2016: D+53.0 2012: D+49.4 2008: D+53.4
Not yet ingested
- Civics
- —
Market trends
- HPI YoY
- ▼ -272.64%
- Current HPI
- 190.7548
- Rent YoY
- —
- Metro
- Chicago-Naperville-Elgin, IL-IN-WI
- State GDP YoY
- ▲ 1.59%
- F500 in state
- 60
Industry mix (Fortune 500 HQ in IL)
| Industry | F500 HQs | Revenue |
|---|---|---|
| Insurance | 4 | $201B |
|
||
| Consumer Goods | 4 | $87B |
|
||
| Industrial Machinery | 3 | $64B |
|
||
| Healthcare | 2 | $55B |
|
||
| Retail / Pharmacy | 1 | $148B |
|
||
| Agriculture / Food | 1 | $86B |
|
||
Price history
+493.8% since first listed5 events — show timeline
- 2026-05-04 Pending — MRED as Distributed by MLS Grid
- 2026-05-01 Listed $285,000 MRED as Distributed by MLS Grid
- 1999-09-21 Sold (Public Records) $145,000 Public Records
- 1991-11-29 Sold (Public Records) $115,000 Public Records
- 1977-03-15 Sold (Public Records) $48,000 Public Records
Property tax history
+3.1%/yrLatest (2023): $6,020 · +11.5% YoY. Source: county tax records.
Cash-flow waterfall
monthlySold comps — $/sqft
last 12 mo · ≤1 miLoading sold comps…