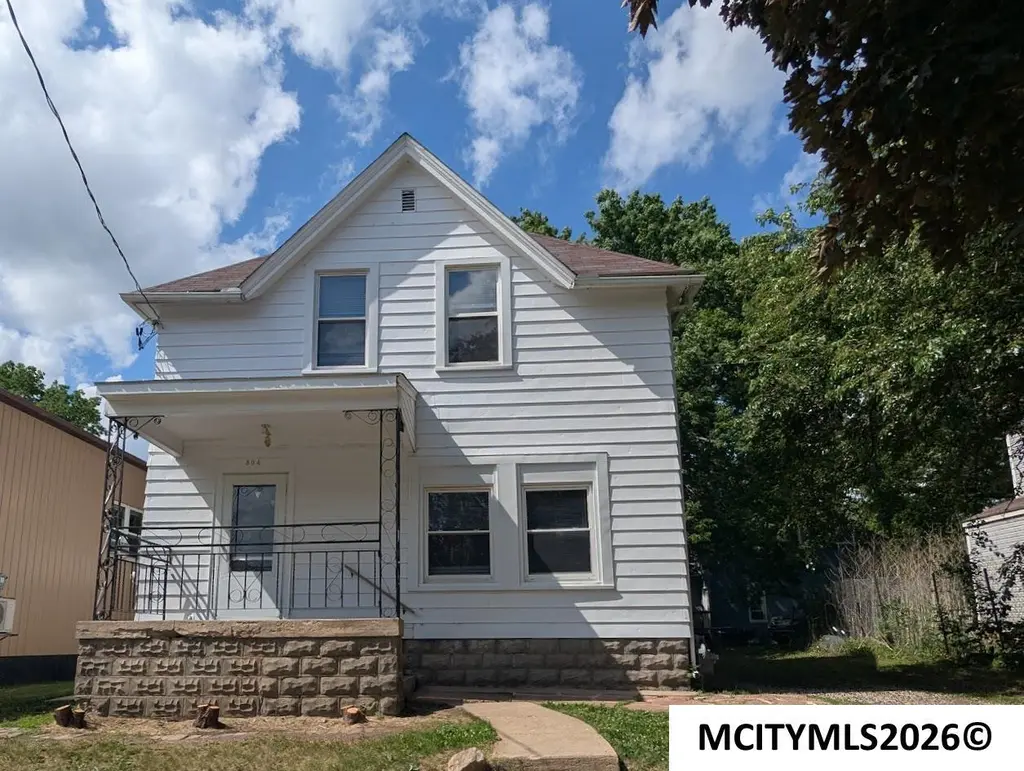
304 1st St SW
Mason City, IA 50401
$99,900B
3 bd · 2.5 ba ·
1,716 sqft ·
Built 1922
· MultiFamily
· Active
· 10 DOM
Cashflow @ list (25.0% down · 7.5%)
Estimated rent
$2,545/mo
Mortgage (P&I)
−$524
Tax + insurance
−$126
HOA
−$0
Vac / Maint / Mgmt
−$534
Net cashflow
$1,361/mo
Annual
$16,332/yr
Cap rate
22.64%
Cash-on-cash
58.39%
DSCR
3.60
1% rule
2.55%
Cash to close
$27,972
Investor read
- This is a 2 × 2-bed/1.0-bath units multifamily listed at $100k.
- At list price, monthly cash flow is $1k ($16k/yr) — positive. Per door: $681/mo.
- The deal already cash-flows at list — no discount required.
- Meets the 1% rule at list price ($3k rent vs $100k).
- Only 10 days on market — expect competitive offers; lowballing is unlikely to land.
- Local home prices are declining (-3.0%/yr); year-one equity from $691 of loan paydown is wiped out by about $3k of value loss. Plan a longer hold.
- Location reads 81/100 on livability (#67 in IA, #1,477 nationally) — a professional / high-income tenant draw. Strengths: commute A+, cost of living A+, housing A+; Watch: amenities F.
- Mason City Community School District (town): math 50% / reading 58% proficiency, ranked #271 of 289 in IA (top 94%) — acceptable for families but not a draw, mixed tenant base, ~2y average lease.
- Zoned schools: Harding Elementary School (math 52% / reading 57%, grade C, #462 of 616 statewide, top 79%, 380 students, 54% FRL); John Adams Middle School (math 46% / reading 54%, grade C, #216 of 246 statewide, top 88%, 480 students, 56% FRL); Mason City High School (math 50% / reading 63%, grade C, #286 of 336 statewide, top 85%, 956 students, 46% FRL).
- Watch-outs: built in 1922 — expect roof / HVAC / electrical / plumbing capex.
- Market conditions: 158 active listings in the ZIP; 2 comparable units currently listed for rent nearby; 54 units permitted in Cerro Gordo County in 2024 (6 in 5+ unit buildings).
- Cerro Gordo County population projected at -18% by 2050 — secular population decline; favor cash flow + early exit over multi-decade hold.
- At projected returns (-3.0% appreciation + 3.0% rent growth), your $28k cash investment doubles in ~2 years — after that, you're playing with house money.
- Cap rate 22.6% vs local median 5.3% in Mason City — top-decile yield for the area; either an underpriced asset or a hidden risk that comps aren't pricing in. Stress-test before assuming the spread holds.
Questions for listing agent
- Can we see the unit-by-unit rent roll, current vacancy, and any below-market leases? What's the average tenancy length?
- What capital expenditures (roof, boiler, parking lot, exteriors) have been made in the last 5 years, and what's planned in the next 2?
- Built in 1922 — when were the roof, HVAC, electrical panel, plumbing, and water heater last replaced?
- Is there a deadline driving the sale (1031 exchange, divorce, estate, relocation)? That informs how much negotiation room exists.
- What's the average days-on-market for RENTAL listings here right now (not sales)? A rising rental-DOM trend means longer vacancies and softer asking-rent achievability than the comps imply.
- What's the recent tenant-quality profile in this submarket — average credit score on applications, eviction rate, late-payment / NSF rate, and stable-employment percentage? A property-management company in the area should have these aggregated.
- How much new apartment / multifamily construction is in the pipeline within 1–3 miles? Heavy new supply (>2% of stock underway) typically softens rents 12–24 months out; light construction supports rent growth.
CashFlowRE · CFR-11J31X6ZD7DVPW
· Data 13 h ago
cashflowre.app · 2026-05-29