 Duplex
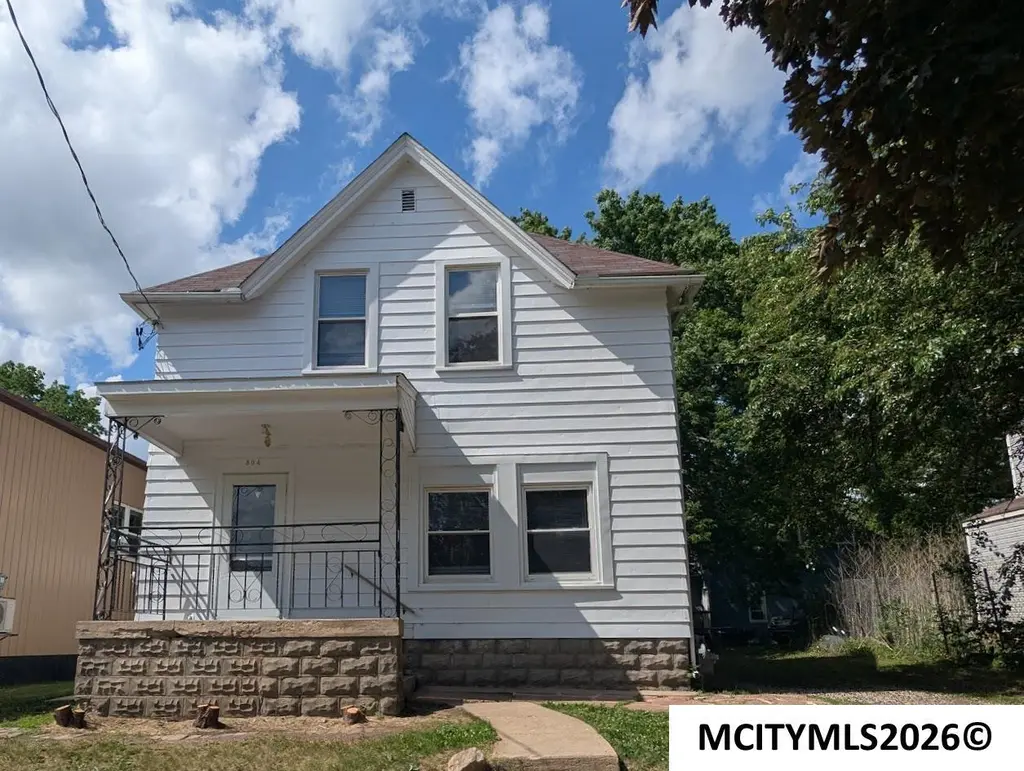
304 1st St SW · Mason City, IA
Flood risk 4/10 · Minor
- FEMA flood zone
- X (unshaded)
- Chance of flooding over 30 yrs
- 0.22%
- Est. flood insurance / yr
- $473 – $860
Fire risk 3/10 · Minor
- Est. fire insurance / yr
- $902 – $1,676
Heat risk 2/10 · Minimal
- Hot days now (above 101°F)
- 7 days/yr
- Hot days in 30 yrs
- 16 days/yr
Wind risk 2/10 · Minimal
- Chance of severe wind over 30 yrs
- —
Air-quality risk 1/10 · Minimal
- Unhealthy air days now
- 0 days/yr
- Unhealthy air days in 30 yrs
- 0 days/yr
Risk factors via First Street. Map © Google.
Why this score? — see what drove the B grade
The composite is a weighted blend of 9 inputs, each scored 0–100. Each bar is that input's sub-score; the figure is the points it added to the 100-point composite (weight × sub-score).
- Cash flow +30.0/30.0
- 1% rule +10.0/10.0
- DSCR +10.0/10.0
- ARV discount +7.5/15.0
- Schools +4.5/10.0
- Livability +4.0/5.0
- Rent growth +2.5/5.0
- Condition / age +2.5/5.0
- Appreciation +0.0/10.0
$99,900
🖨 Deal sheet (PDF) 📄 Offer letter ✓ Due diligence
Multi-family units
County records classify this as Multi-Family (2-4 Unit). Listing-text estimate: 2 units. confirmed
Listing remarks
This updated duplex offers the perfect opportunity for investors or owner-occupants looking to generate rental income. Built in 1922, this property combines timeless charm with modern updates, making it move-in & rent-ready from day 1. The main-floor unit features 2 bdrms, full bath, spacious living room, kitchen AND separate formal dining room. One of its most remarkable features is the breathtaking original ceiling detail - an extraordinary decorative design that has been preserved for over a century. Its intricate craftsmanship is truly one-of-a-kind & creates a dramatic focal point throughout the space. The upper unit offers 2 bdrms, full bath, kitchen & living room. R
Key facts
- 4,700 sq ft lot
- Built 1922
- Listed 10 days
Property features AI
Finance
- Financial info: Annual tax noted
Exterior
- Utilities: Public water; Public sewer
- Home design: Duplex (residential income property); Multi-family
- Construction: Aluminum siding
- Exterior features: Lot approximately 50 x 94; Z2 - Sub-Urban zoning
Interior
- Kitchen: Electric range; Refrigerator
- Heating & cooling: Forced air heating; Natural gas
- Interior features: Electric range; Refrigerator; Forced air heating; Natural gas heating
Neighborhood map
What this means for you Summary
Snapshot
- This is a 2 × 2-bed/1.0-bath units multifamily listed at $100k.
Deal economics
- At list price, monthly cash flow is $1k ($16k/yr) — positive. Per door: $681/mo.
- The deal already cash-flows at list — no discount required.
- Meets the 1% rule at list price ($3k rent vs $100k).
- Cap rate 22.6% vs local median 5.3% in Mason City — top-decile yield for the area; either an underpriced asset or a hidden risk that comps aren't pricing in. Stress-test before assuming the spread holds.
Location & tenants
- Location reads 81/100 on livability (#67 in IA, #1,477 nationally) — a professional / high-income tenant draw. Strengths: commute A+, cost of living A+, housing A+; Watch: amenities F.
- Mason City Community School District (town): math 50% / reading 58% proficiency, ranked #271 of 289 in IA (top 94%) — acceptable for families but not a draw, mixed tenant base, ~2y average lease.
- Zoned schools: Harding Elementary School (math 52% / reading 57%, grade C, #462 of 616 statewide, top 79%, 380 students, 54% FRL); John Adams Middle School (math 46% / reading 54%, grade C, #216 of 246 statewide, top 88%, 480 students, 56% FRL); Mason City High School (math 50% / reading 63%, grade C, #286 of 336 statewide, top 85%, 956 students, 46% FRL).
- Market conditions: 158 active listings in the ZIP; 2 comparable units currently listed for rent nearby; 54 units permitted in Cerro Gordo County in 2024 (6 in 5+ unit buildings).
Forward outlook
- Local home prices are declining (-3.0%/yr); year-one equity from $691 of loan paydown is wiped out by about $3k of value loss. Plan a longer hold.
- Cerro Gordo County population projected at -18% by 2050 — secular population decline; favor cash flow + early exit over multi-decade hold.
- At projected returns (-3.0% appreciation + 3.0% rent growth), your $28k cash investment doubles in ~2 years — after that, you're playing with house money.
Negotiation context
- Only 10 days on market — expect competitive offers; lowballing is unlikely to land.
Risks & watch-outs
- Watch-outs: built in 1922 — expect roof / HVAC / electrical / plumbing capex.
Questions for the listing agent
- Can we see the unit-by-unit rent roll, current vacancy, and any below-market leases? What's the average tenancy length?
- What capital expenditures (roof, boiler, parking lot, exteriors) have been made in the last 5 years, and what's planned in the next 2?
- Built in 1922 — when were the roof, HVAC, electrical panel, plumbing, and water heater last replaced?
- Is there a deadline driving the sale (1031 exchange, divorce, estate, relocation)? That informs how much negotiation room exists.
- What's the average days-on-market for RENTAL listings here right now (not sales)? A rising rental-DOM trend means longer vacancies and softer asking-rent achievability than the comps imply.
- What's the recent tenant-quality profile in this submarket — average credit score on applications, eviction rate, late-payment / NSF rate, and stable-employment percentage? A property-management company in the area should have these aggregated.
- How much new apartment / multifamily construction is in the pipeline within 1–3 miles? Heavy new supply (>2% of stock underway) typically softens rents 12–24 months out; light construction supports rent growth.
Investment metrics
- 1% rule
- 2.55% ✓
- Cap rate
- 22.64%
- Cash-on-cash
- 58.39%
- DSCR
- 3.60
- GRM
- 3.3
CMA / ARV
- ARV (on-the-fly)
- $29,172
- Comps found
- 1
Show comp detail 1 sale within ~0.75 mi
| Address | Dist | Beds/Ba | Sqft | Sold | Price | $/sf | Match |
|---|---|---|---|---|---|---|---|
| 709 S Pennsylvania Ave | 0.62mi | 3/2.5 | 1,661 (-3%) | 10mo | $28,350 | $17 | 57 |
Match score weights: distance 35% · size 25% · config 20% · recency 20%. Top-matched comps best support the ARV.
Projected returns pro-forma
-3.0% appreciation · 3.0% rent growth · sell at horizon
- IRR
- 57.0%
- Equity multiple
- 3.52×
- Total profit
- $70,510
- Equity at exit
- $14,895
- IRR
- 61.9%
- Equity multiple
- 7.19×
- Total profit
- $173,074
- Equity at exit
- $8,638
Cash invested: $27,972 (down + closing). Projections, not guarantees.
Landlord ↔ Tenant lean methodology
- Overall (STATE)
- 83 Strongly Landlord-Friendly
- State Iowa
- 83 Strongly Landlord-Friendly · R+6
- County
- — inherits STATE
- City
- — inherits STATE
ZIP-level market 50401
- Active inventory
- 158
- Price-to-rent
- 6.5×
Monthly cashflow live
- Estimated rent
- $2,545 medium interval (Pro) →
- Mortgage (P&I)
- −$524
- Tax from tax record
- −$84 /mo · $1,008/yr
- Insurance
- −$42
- HOA
- −$0
- Vacancy / Maint / Mgmt
- −$534
- Net cashflow
- $1,361
Break-even live
Sensitivity live
| Price | -10% $1,418 | -5% $1,389 | +0% $1,361 | +5% $1,333 | +10% $1,304 |
|---|---|---|---|---|---|
| Rent | -10% $1,160 | -5% $1,261 | +0% $1,361 | +5% $1,462 | +10% $1,562 |
| Rate | -1.0pp $1,411 | -0.5pp $1,386 | base $1,361 | +0.5pp $1,335 | +1.0pp $1,309 |
2-unit breakdown (identical units grouped — click to expand)
| Units | Beds | Baths | Est. rent |
|---|---|---|---|
| 2× units | 2 | 1 | $2,546 |
| #1 | 2 | 1 | $1,273 |
| #2 | 2 | 1 | $1,273 |
| Total (2 units) | $2,545 | ||
UW: 25.0% down · 7.5% · 30yr · 1.5% tax · 5.0% vac · 8.0% maint · 8.0% mgmt
Financing live
Cash to close
- Down payment
- $24,975
- Closing costs
- $2,997
- Reserves months
- —
- Total cash needed
- —
Loan-product check · same deal, 3 products live
Conventional
25% down · 7.5% · 30yr
- Down + closing
- —
- Monthly P&I
- —
- Monthly cashflow
- —
- DSCR
- —
- Eligible?
- —
Personal DTI + credit; lowest rate.
DSCR
20% down · 8.5% · 30yr
- Down + closing
- —
- Monthly P&I
- —
- Monthly cashflow
- —
- DSCR
- —
- Eligible?
- —
No personal income docs; deal must DSCR.
Hard money
10% down · 12.0% · 12mo
- Down + closing
- —
- Monthly P&I
- —
- Monthly cashflow
- —
- DSCR
- —
- Eligible?
- —
Short-term bridge; refi at stabilization.
Rent comps 2 comps
| Address | Beds | Baths | Sqft | Rent | $/sqft | DOM | Units | Dist |
|---|---|---|---|---|---|---|---|---|
| 215 2nd St SW Unit 100-210 Mason City, IA | 3.0 | 2.0 | 1273 | $1,580 | $1.24 | 45d | 1 | 0.11mi |
| 12 2nd St NE Unit 6 Mason City, IA | 2.0 | 1.0 | 1296 | $1,600 | $1.23 | 45d | 1 | 0.33mi |
Listing history 9 events
-
2026-06-21days on market $99,900 Active 10 DOM
-
2026-06-21days on market $99,900 Active 9 DOM
-
2026-06-18days on market $99,900 Active 7 DOM
-
2026-06-17days on market $99,900 Active 6 DOM
-
2026-06-16days on market $99,900 Active 5 DOM
-
2026-06-15days on market $99,900 Active 4 DOM
-
2026-06-13days on market $99,900 Active 2 DOM
-
2026-06-12remarks 687-char remark
-
2026-06-12$99,900 Active 1 DOM
ⓘ Source: listings_history table (triggers on properties + properties_extension) + one-shot
backfill from property_details.listing_events for pre-trigger history.
Tax reassessment forecast IA · Partial reset (capped growth)
- Current annual tax
- $1,008 · $84/mo
- Projected year-2 tax
- $1,288 · $107/mo
- Expected delta
- +$280/yr (+$23/mo · 27.8%)
ⓘ Screening estimate from a state-policy table — verify with the county assessor before closing.
Climate risk First Street
- Flood 4/10 Moderate FEMA zone X (unshaded) · 22% chance over 30 yrs
- Wildfire 3/10 Moderate
- Heat 2/10 Low 7 d/yr ≥101°F today · 16 d/yr by 30 yrs out
- Wind 2/10 Low
- Air quality 1/10 Low 0 unhealthy d/yr today · 0 by 30 yrs out
Nearby sold comps map
Loading sold comps map…
Walkable amenities ~0.75 mi
Loading nearby amenities…
Taxation est. · year 1
- Rental income
- $30,540
- − Mortgage interest
- −$5,596
- − Property taxes
- −$1,008
- − Insurance
- −$500
- − Repairs & maintenance
- −$2,443
- − Management
- −$2,443
- − Depreciation
- −$2,906
- Taxable income
- $15,644
- Est. tax owed @ 24.0%
- −$3,755
- After-tax cash flow
- $12,578/yr
For passive investors: Depreciation is non-cash, so a rental often shows a tax loss while cash-flowing — sheltering income. Rental losses are passive: they offset passive income freely, and up to $25,000/yr can offset ordinary (W-2) income if you actively participate and your MAGI is under $100k (phasing out to $0 by $150k); unused losses carry forward. On sale, claimed depreciation is recaptured at up to 25%, and gains may owe capital-gains tax (a 1031 exchange can defer both). Figures are a year-1 estimate at your 24.0% rate — not tax advice; consult a CPA.
Schools (NCES district)
- District
- Mason City Community School District
- NCES district ID
- 1918780
- Math proficiency
- 50% ▼ -1.00%
- Reading proficiency
- 58% ▼ -7.00%
- Median HH income
- $43,668
- Composite
- 45.47/100
- National rank
- #2614
- State rank
- #271 of 289 in IA
Livability — Mason City
- Score
- 81/100
- State rank
- #67
- US rank
- #1477
Category grades
Schools grade is shown separately in the Schools card above.
Census & demographics
- Census place
- Mason City, IA
- City population
- 28,818
- Population (ZIP)
- 28,818
Population outlook (Cerro Gordo County) Hauer SSP2
- Today (2025)
- 41,080 people
- By 2030
- 39,746 · -3.2%
- By 2040
- 36,608 · -10.9%
- By 2050
- 33,682 · -18.0%
- By 2075
- 29,702 · -27.7%
- By 2100
- 27,399 · -33.3%
Race, ethnicity, and origin ACS 2023
- Neighborhood character
- Predominantly White (87%)
- Race & ethnicity
- White 87% Hispanic / Latino 6% Two or more races 5% Black 3% Asian 1%
- Hispanic origin (detail)
- Mexican 5%
- Common ancestry
- Portuguese 12% Iranian 2% Lithuanian 2%
- Foreign-born
- 2% · Canada, Vietnam
- Languages at home
- 96% English-only · Spanish 3% Other Asian/Pacific 1%
Political lean MEDSL · Cerro Gordo
- 2024 margin
- R (+11.7) · D 43.4% · R 55.0% · Other 1.6%
- 2008→2024 swing
- -32.5pp toward R · 2008: 20.8pp · 2024: -11.7pp
- All cycles
- 2024: R+11.7 2020: R+6.3 2016: R+7.7 2012: D+13.2 2008: D+20.8
Not yet ingested
- Civics
- —
Market trends
- HPI YoY
- ▼ -130.01%
- Current HPI
- 199.1966
- Rent YoY
- —
- Metro
- —
- State GDP YoY
- ▲ 2.48%
- F500 in state
- 4
Industry mix (Fortune 500 HQ in IA)
| Industry | F500 HQs | Revenue |
|---|---|---|
| Financial Services | 1 | $16B |
|
||
| Retail / Convenience | 1 | $15B |
|
||
Price history
1 event — show timeline
- 2026-06-11 Listed $99,900 Greater Mason BOR
Property tax history
+0.6%/yrLatest (2025): $1,008 · +2.9% YoY. Source: county tax records.
Cash-flow waterfall
monthlySold comps — $/sqft
last 12 mo · ≤1 miLoading sold comps…