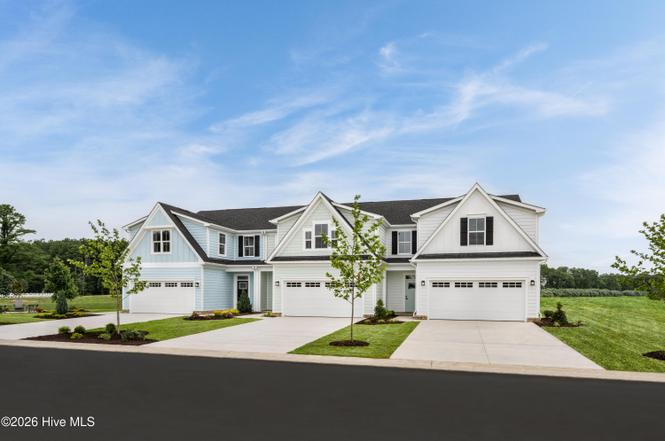
Lt 3b Albemarle Villas
Winfall, NC 27944
$264,990D+
3 bd · 2.5 ba ·
1,775 sqft ·
Built 2026
· Townhouse
· Active
· 1 DOM
Cashflow @ list (25.0% down · 7.5%)
Estimated rent
$2,500/mo
Mortgage (P&I)
−$1,390
Tax + insurance
−$442
HOA
−$280
Vac / Maint / Mgmt
−$525
Net cashflow
$-136/mo
Annual
$-1,635/yr
Cap rate
5.68%
Cash-on-cash
-2.20%
DSCR
0.90
1% rule
0.94%
Cash to close
$74,197
Investor read
- This is a 3-bed/2.5-bath townhouse listed at $265k. Condition is rated good.
- At list price, monthly cash flow is $-136 ($-2k/yr) — negative.
- To cash-flow at today's rent, offer at most $245k (7.4% below list).
- To meet the 1% rule (rent ≥ 1% of price), the offer needs to be $250k (5.7% below list).
- Only 1 days on market — expect competitive offers; lowballing is unlikely to land.
- Recommended offer: $245k (7.4% below list) — sets the bar for cash-flow.
- In year one you build about $28k of equity ($2k loan paydown + $26k appreciation (10.0% local appreciation)).
- Location reads 50/100 on livability (#705 in NC) — a working-class tenant base; expect higher turnover. Strengths: housing A+, crime A; Watch: amenities F, commute F, employment F.
- Perquimans County Schools (rural): math 44% / reading 48% proficiency, ranked #83 of 178 in NC (top 47%) — families likely to look elsewhere, expect single-tenant / working-renter base with shorter leases.
- Zoned schools: Perquimans Central (391 students, 65% FRL); Perquimans County Middle (math 39% / reading 48%, grade D, #182 of 475 statewide, top 40%, 366 students, 59% FRL); Perquimans County High (math 47% / reading 42%, grade F, #352 of 535 statewide, top 68%, 518 students, 59% FRL).
- Market conditions: 339 active listings in the ZIP; 1 comparable units currently listed for rent nearby; 46 units permitted in Perquimans County in 2024 (0 in 5+ unit buildings).
- Perquimans County population projected at -16% by 2050 — secular population decline; favor cash flow + early exit over multi-decade hold.
- By year 2, paydown + projected appreciation supports a ~$46k cash-out refi (75% LTV) — recoverable capital for the next deal without selling this one.
- Cap rate 5.7% vs local median 3.6% in Winfall — top-decile yield for the area; either an underpriced asset or a hidden risk that comps aren't pricing in. Stress-test before assuming the spread holds.
Questions for listing agent
- What do current leases actually rent for vs. the listed asking? Can we see a recent rent roll and the last 12 months of T-12 income?
- What does the HOA fee cover, when was the last increase, and are there any pending special assessments or reserve-fund shortfalls?
- Is there a deadline driving the sale (1031 exchange, divorce, estate, relocation)? That informs how much negotiation room exists.
- Schools are F-rated, which usually means shorter tenancies and higher turnover. Who's the typical renter profile here, and what's been the actual vacancy rate?
- The area grade is low — what's the realistic commute time and amenity access for the typical tenant pool here? Any planned neighborhood developments (good or bad) we should know about?
- What's the average days-on-market for RENTAL listings here right now (not sales)? A rising rental-DOM trend means longer vacancies and softer asking-rent achievability than the comps imply.
- What's the recent tenant-quality profile in this submarket — average credit score on applications, eviction rate, late-payment / NSF rate, and stable-employment percentage? A property-management company in the area should have these aggregated.
- How much new for-sale + rental construction is in the pipeline within 1–3 miles? Heavy new supply typically softens prices + rents 12–24 months out; constrained supply supports both.
CashFlowRE · CFR-12PFAPB7J2EE3G
· Data 1 day ago
cashflowre.app · 2026-05-29