Lt 3b Albemarle Villas · Winfall, NC
Flood risk No data
- FEMA flood zone
- —
- Chance of flooding over 30 yrs
- —
- Est. flood insurance / yr
- —
Fire risk No data
- Est. fire insurance / yr
- —
Heat risk No data
- Hot days now (above threshold)
- —
- Hot days in 30 yrs
- —
Wind risk No data
- Chance of severe wind over 30 yrs
- —
Air-quality risk No data
- Unhealthy air days now
- —
- Unhealthy air days in 30 yrs
- —
Risk factors via First Street. Map © Google.
Why this score? — see what drove the D+ grade
The composite is a weighted blend of 9 inputs, each scored 0–100. Each bar is that input's sub-score; the figure is the points it added to the 100-point composite (weight × sub-score).
- Cash flow +10.5/30.0
- Appreciation +10.0/10.0
- ARV discount +7.5/15.0
- 1% rule +4.4/10.0
- Condition / age +4.0/5.0
- Schools +3.9/10.0
- DSCR +3.0/10.0
- Rent growth +2.5/5.0
- Livability +2.5/5.0
$264,990
🖨 Deal sheet 📄 Offer letter ✓ Due diligence
Listing remarks
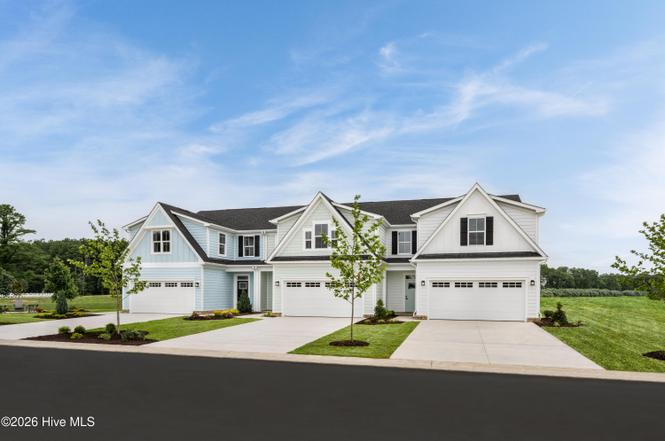
Grand Opening of Albemarle Villas - Limited-Time grand-opening incentives through 6/21! Discover effortless, low-maintenance living at Albemarle Villas, where thoughtfully designed homes feature main-level living and beautifully crafted spaces. Enjoy maintenance-free yards, 2-car garages, and access to exceptional multi-million-dollar amenities. Come experience the ease and elegance of villa living at Albemarle--schedule your tour today!
Key facts
- Main-level living
- $280 HOA
- 2 garage spots
Tags
Property features AI
Finance
- HOA & community: Homeowners association with annual fee (approximately $3,360 annually / $280 monthly); Community amenities include boat dock, marina, clubhouse, pool, fitness center, golf course, jogging path, playground, tennis courts, sport court, trails, dog park, storage, maintenance of grounds, and water access
Exterior
- Parking: Attached 2-car garage; Garage faces front; Covered parking on concrete
- Security: Community security
- Utilities: Cable available; Sewer available; Water available; Other utilities available
- Home design: Townhouse; Two levels (2 stories); Entry level: 1; New construction; Has view
- Construction: Fiber cement and frame construction; Shingle roof; Slab foundation
- Exterior features: Boat slip; Porch
Interior
- Kitchen: Refrigerator; Disposal; Dishwasher; ENERGY STAR qualified appliances; Electric range; Microwave; Electric water heater
- Bedrooms: Total rooms: 6
- Flooring: Carpet
- Bathrooms: Two full bathrooms; One half bathroom
- Heating & cooling: Central air conditioning; Electric heating; Other heating
- Interior features: Walk-in closets; Entrance foyer; Kitchen island; Pantry
- Laundry & utility: Washer hookup
Neighborhood map
What this means for you Summary
Snapshot
- This is a 3-bed/2.5-bath townhouse listed at $265k. Condition is rated good.
Deal economics
- At list price, monthly cash flow is $-136 ($-2k/yr) — negative.
- To cash-flow at today's rent, offer at most $245k (7.4% below list).
- To meet the 1% rule (rent ≥ 1% of price), the offer needs to be $250k (5.7% below list).
- Recommended offer: $245k (7.4% below list) — sets the bar for cash-flow.
- Cap rate 5.7% vs local median 3.6% in Winfall — top-decile yield for the area; either an underpriced asset or a hidden risk that comps aren't pricing in. Stress-test before assuming the spread holds.
Location & tenants
- Location reads 50/100 on livability (#705 in NC) — a working-class tenant base; expect higher turnover. Strengths: housing A+, crime A; Watch: amenities F, commute F, employment F.
- Perquimans County Schools (rural): math 44% / reading 48% proficiency, ranked #83 of 178 in NC (top 47%) — families likely to look elsewhere, expect single-tenant / working-renter base with shorter leases.
- Zoned schools: Perquimans Central (391 students, 65% FRL); Perquimans County Middle (math 39% / reading 48%, grade D, #182 of 475 statewide, top 40%, 366 students, 59% FRL); Perquimans County High (math 47% / reading 42%, grade F, #352 of 535 statewide, top 68%, 518 students, 59% FRL).
- Market conditions: 339 active listings in the ZIP; 1 comparable units currently listed for rent nearby; 46 units permitted in Perquimans County in 2024 (0 in 5+ unit buildings).
Forward outlook
- In year one you build about $28k of equity ($2k loan paydown + $26k appreciation (10.0% local appreciation)).
- Perquimans County population projected at -16% by 2050 — secular population decline; favor cash flow + early exit over multi-decade hold.
- By year 2, paydown + projected appreciation supports a ~$46k cash-out refi (75% LTV) — recoverable capital for the next deal without selling this one.
Negotiation context
- Only 1 days on market — expect competitive offers; lowballing is unlikely to land.
Questions for the listing agent
- What do current leases actually rent for vs. the listed asking? Can we see a recent rent roll and the last 12 months of T-12 income?
- What does the HOA fee cover, when was the last increase, and are there any pending special assessments or reserve-fund shortfalls?
- Is there a deadline driving the sale (1031 exchange, divorce, estate, relocation)? That informs how much negotiation room exists.
- Schools are F-rated, which usually means shorter tenancies and higher turnover. Who's the typical renter profile here, and what's been the actual vacancy rate?
- The area grade is low — what's the realistic commute time and amenity access for the typical tenant pool here? Any planned neighborhood developments (good or bad) we should know about?
- What's the average days-on-market for RENTAL listings here right now (not sales)? A rising rental-DOM trend means longer vacancies and softer asking-rent achievability than the comps imply.
- What's the recent tenant-quality profile in this submarket — average credit score on applications, eviction rate, late-payment / NSF rate, and stable-employment percentage? A property-management company in the area should have these aggregated.
- How much new for-sale + rental construction is in the pipeline within 1–3 miles? Heavy new supply typically softens prices + rents 12–24 months out; constrained supply supports both.
Investment metrics
- 1% rule
- 0.94% ✗
- Cap rate
- 5.68%
- Cash-on-cash
- -2.20%
- DSCR
- 0.90
- GRM
- 8.8
CMA / ARV
No comps found within radius.
Projected returns pro-forma
10.0% appreciation · 3.0% rent growth · sell at horizon
- IRR
- 22.7%
- Equity multiple
- 2.83×
- Total profit
- $135,850
- Equity at exit
- $238,724
- IRR
- 20.4%
- Equity multiple
- 6.49×
- Total profit
- $407,300
- Equity at exit
- $514,817
Cash invested: $74,197 (down + closing). Projections, not guarantees.
Landlord ↔ Tenant lean methodology
- Overall (STATE)
- 85 Strongly Landlord-Friendly
- State North Carolina
- 85 Strongly Landlord-Friendly · R+3
- County
- — inherits STATE
- City
- — inherits STATE
ZIP-level market 27944
- Home prices YoY
- 9.5%
- Active inventory
- 339
- Price-to-rent
- 8.8×
Monthly cashflow live
- Estimated rent
- $2,500 medium interval (Pro) →
- Mortgage (P&I)
- −$1,390
- Tax est. 1.5%
- −$331 /mo · $3,975/yr
- Insurance
- −$110
- HOA
- −$280
- Vacancy / Maint / Mgmt
- −$525
- Net cashflow
- $-136
Break-even live
UW: 25.0% down · 7.5% · 30yr · 1.5% tax · 5.0% vac · 8.0% maint · 8.0% mgmt
Financing live
Cash to close
- Down payment
- $66,248
- Closing costs
- $7,950
- Reserves months
- —
- Total cash needed
- —
Loan-product check · same deal, 3 products live
Conventional
25% down · 7.5% · 30yr
- Down + closing
- —
- Monthly P&I
- —
- Monthly cashflow
- —
- DSCR
- —
- Eligible?
- —
Personal DTI + credit; lowest rate.
DSCR
20% down · 8.5% · 30yr
- Down + closing
- —
- Monthly P&I
- —
- Monthly cashflow
- —
- DSCR
- —
- Eligible?
- —
No personal income docs; deal must DSCR.
Hard money
10% down · 12.0% · 12mo
- Down + closing
- —
- Monthly P&I
- —
- Monthly cashflow
- —
- DSCR
- —
- Eligible?
- —
Short-term bridge; refi at stabilization.
Rent comps 1 comps
| Address | Beds | Baths | Sqft | Rent | $/sqft | DOM | Units | Dist |
|---|---|---|---|---|---|---|---|---|
| 134 Cottonwood Dr Hertford, NC | 3.0 | 3.0 | 2068 | $2,500 | $1.21 | 23d | 1 | 1.34mi |
HOA detail
- Monthly dues
- $280 · $3,360/yr
Listing history 2 events
-
2026-06-18remarks 441-char remark
-
2026-06-18$264,990 Active 1 DOM
ⓘ Source: listings_history table (triggers on properties + properties_extension) + one-shot
backfill from property_details.listing_events for pre-trigger history.
Nearby sold comps map
Loading sold comps map…
Walkable amenities ~0.75 mi
Loading nearby amenities…
Taxation est. · year 1
- Rental income
- $30,000
- − Mortgage interest
- −$14,844
- − Property taxes
- −$3,975
- − Insurance
- −$1,325
- − Repairs & maintenance
- −$2,400
- − Management
- −$2,400
- − HOA
- −$3,360
- − Depreciation
- −$7,709
- Taxable loss
- −$6,012
- Est. tax savings @ 24.0%
- +$1,443
- After-tax cash flow
- $-193/yr
For passive investors: Depreciation is non-cash, so a rental often shows a tax loss while cash-flowing — sheltering income. Rental losses are passive: they offset passive income freely, and up to $25,000/yr can offset ordinary (W-2) income if you actively participate and your MAGI is under $100k (phasing out to $0 by $150k); unused losses carry forward. On sale, claimed depreciation is recaptured at up to 25%, and gains may owe capital-gains tax (a 1031 exchange can defer both). Figures are a year-1 estimate at your 24.0% rate — not tax advice; consult a CPA.
Condition & rehab AI · 12 photos
This townhouse is in excellent condition with modern amenities and a well-maintained exterior. It's move-in ready and would benefit from landscaping and smart home integration to further enhance its value.
Value-add opportunities
- Both Landscaping — Enhances curb appeal and adds value
- Both Smart home integration — Improves convenience and adds modern appeal
Renovation cost estimate screening
Value-add ROI direction
- Both Landscaping — Enhances curb appeal and adds value ↑
- Both Smart home integration — Improves convenience and adds modern appeal ↑
ⓘ Cost ranges are severity-bucket heuristics (US national rule-of-thumb). Get contractor quotes + a written scope before underwriting a rehab budget.
Schools (NCES district)
- District
- Perquimans County Schools
- NCES district ID
- 3703600
- Math proficiency
- 44% ▲ 6.00%
- Reading proficiency
- 48% ▲ 7.00%
- Median HH income
- $42,593
- Composite
- 38.75/100
- National rank
- #4124
- State rank
- #83 of 178 in NC
Livability — Winfall
- Score
- 50/100
- State rank
- #705
- US rank
- #25598
Category grades
Schools grade is shown separately in the Schools card above.
Census & demographics
- Census place
- Winfall, NC
- Population (ZIP)
- 11,255
Population outlook (Perquimans County) Hauer SSP2
- Today (2025)
- 13,018 people
- By 2030
- 12,716 · -2.3%
- By 2040
- 11,895 · -8.6%
- By 2050
- 10,981 · -15.6%
- By 2075
- 8,931 · -31.4%
- By 2100
- 7,101 · -45.5%
Race, ethnicity, and origin ACS 2023
- Neighborhood character
- Predominantly White (71%)
- Race & ethnicity
- White 71% Black 20% Two or more races 5% Hispanic / Latino 3%
- Common ancestry
- Lithuanian 3% Serbian 2% Slovak 2%
- Foreign-born
- 3% · Canada, China, Dominican Republic
- Languages at home
- 96% English-only · Spanish 3%
Political lean MEDSL · Perquimans
- 2024 margin
- Solid R (+39.4) · D 29.7% · R 69.1% · Other 1.2%
- 2008→2024 swing
- -25.4pp toward R · 2008: -13.9pp · 2024: -39.4pp
- All cycles
- 2024: R+39.4 2020: R+32.2 2016: R+28.1 2012: R+16.1 2008: R+13.9
Not yet ingested
- Civics
- —
Market trends
- HPI YoY
- ▲ 22.77%
- Current HPI
- 261.91
- Rent YoY
- —
- Metro
- —
- State GDP YoY
- ▲ 3.28%
- F500 in state
- 26
Industry mix (Fortune 500 HQ in NC)
| Industry | F500 HQs | Revenue |
|---|---|---|
| Financial Services | 2 | $213B |
|
||
| Retail | 2 | $95B |
|
||
| Industrial Conglomerate | 1 | $38B |
|
||
| Metals / Steel | 1 | $35B |
|
||
| Utilities | 1 | $30B |
|
||
| Industrial Machinery | 1 | $19B |
|
||
Price history
1 event — show timeline
- 2026-06-18 Listed $264,990 Hive MLS
Cash-flow waterfall
monthlySold comps — $/sqft
last 12 mo · ≤1 miLoading sold comps…