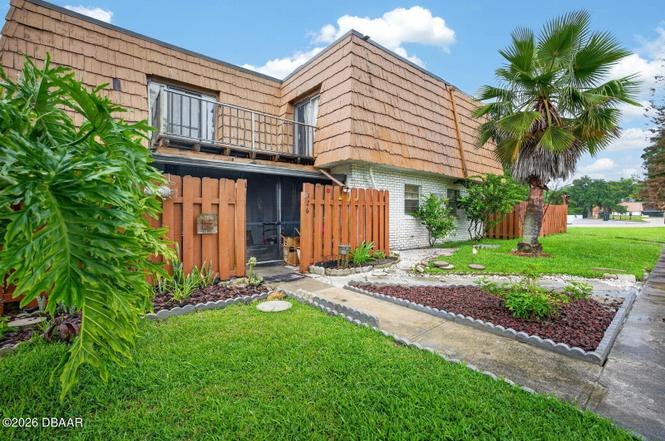
126 Moonstone Ct
Port Orange, FL 32129
$159,900C-
2 bd · 2.0 ba ·
1,400 sqft ·
Built 1978
· Townhouse
· Active
· 2 DOM
Cashflow @ list (25.0% down · 7.5%)
Estimated rent
$1,739/mo
Mortgage (P&I)
−$839
Tax + insurance
−$693
HOA
−$105
Vac / Maint / Mgmt
−$365
Net cashflow
$-263/mo
Annual
$-3,152/yr
Cap rate
7.52%
Cash-on-cash
4.39%
DSCR
1.20
1% rule
1.09%
Cash to close
$44,772
Investor read
- This is a 2-bed/2.0-bath townhouse listed at $160k.
- At list price, monthly cash flow is $-263 ($-3k/yr) — negative.
- To cash-flow at today's rent, offer at most $122k (23.8% below list).
- Meets the 1% rule at list price ($2k rent vs $160k).
- Only 2 days on market — expect competitive offers; lowballing is unlikely to land.
- Recommended offer: $122k (23.8% below list) — sets the bar for cash-flow.
- Local home prices are declining (-3.0%/yr); year-one equity from $1k of loan paydown is wiped out by about $5k of value loss. Plan a longer hold.
- Location reads 80/100 on livability (#131 in FL, #1,957 nationally) — a professional / high-income tenant draw. Strengths: housing A+, health & safety A+, cost of living A; Watch: amenities D+, commute D+.
- Volusia (suburban): math 44% / reading 49% proficiency, ranked #47 of 73 in FL (top 64%) — families likely to look elsewhere, expect single-tenant / working-renter base with shorter leases.
- Watch-outs: flood insurance adds $427/mo.
- Market conditions: Rents soft (-2.7%/yr); 247 active listings in the ZIP; 37 comparable units currently listed for rent nearby; rentals at typical pace (median 22d on market — plan ~3-4 weeks tenant-placement turnaround); 3,402 units permitted in Volusia County in 2024 (681 in 5+ unit buildings).
- Volusia County population projected at +19% by 2050 — long-run rental-demand tailwind backs the buy-and-hold thesis.
- Current owner paid $38k; list at $160k implies a 321% gain — meaningful room to come down on a strong offer.
- Climate carrying-cost: in FEMA flood zone AE (mandatory federal flood insurance); severe wind risk, 99% chance of damaging wind over 30y; extreme-heat days projected 7→20/yr by 2055 (HVAC capex compounding) — expect insurance premiums to compound above CPI over the hold.
- This rent runs 31% of the median local income ($68k/yr) — at the standard rent-burdened threshold; future hikes will face affordability resistance.
Questions for listing agent
- What do current leases actually rent for vs. the listed asking? Can we see a recent rent roll and the last 12 months of T-12 income?
- Built in 1978 — when were the roof, HVAC, electrical panel, plumbing, and water heater last replaced?
- What's the actual annual flood-insurance premium (NFIP or private), and is the property in a SFHA with mandatory coverage?
- What does the HOA fee cover, when was the last increase, and are there any pending special assessments or reserve-fund shortfalls?
- Is there a deadline driving the sale (1031 exchange, divorce, estate, relocation)? That informs how much negotiation room exists.
- Schools are B-rated — typically a magnet for longer-tenancy family renters. What's the average tenant stay here, and is there a school-zone premium baked into asking?
- What's the average days-on-market for RENTAL listings here right now (not sales)? A rising rental-DOM trend means longer vacancies and softer asking-rent achievability than the comps imply.
- What's the recent tenant-quality profile in this submarket — average credit score on applications, eviction rate, late-payment / NSF rate, and stable-employment percentage? A property-management company in the area should have these aggregated.
CashFlowRE · CFR-12V9VC18EDNPXH
· Data 2 days ago
cashflowre.app · 2026-05-29