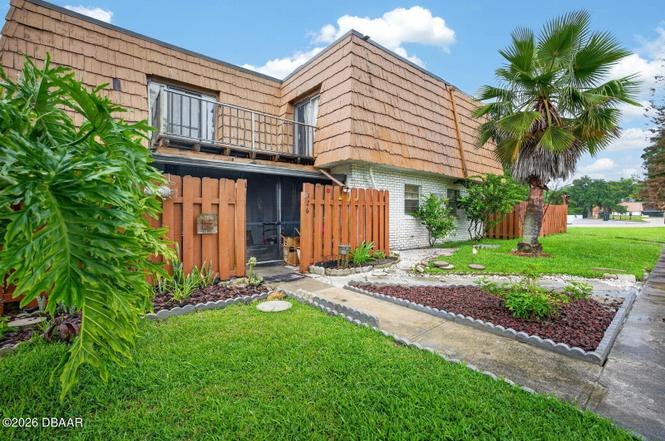
126 Moonstone Ct · Port Orange, FL
Flood risk 7/10 · Major
- FEMA flood zone
- AE
- Chance of flooding over 30 yrs
- 0.76%
- Est. flood insurance / yr
- $1,737 – $8,500
Fire risk 1/10 · Minimal
- Est. fire insurance / yr
- $947 – $1,759
Heat risk 9/10 · Severe
- Hot days now (above 105°F)
- 7 days/yr
- Hot days in 30 yrs
- 20 days/yr
Wind risk 10/10 · Severe
- Chance of severe wind over 30 yrs
- 99.0%
Air-quality risk 2/10 · Minimal
- Unhealthy air days now
- 1 days/yr
- Unhealthy air days in 30 yrs
- 1 days/yr
Risk factors via First Street. Map © Google.
Why this score? — see what drove the C- grade
The composite is a weighted blend of 9 inputs, each scored 0–100. Each bar is that input's sub-score; the figure is the points it added to the 100-point composite (weight × sub-score).
- Cash flow +18.9/30.0
- ARV discount +7.5/15.0
- DSCR +6.0/10.0
- 1% rule +5.9/10.0
- Livability +4.0/5.0
- Schools +3.9/10.0
- Condition / age +2.5/5.0
- Rent growth +1.8/5.0
- Appreciation +0.0/10.0
$159,900
🖨 Deal sheet 📄 Offer letter ✓ Due diligence
Listing remarks
Pond views, a remodeled kitchen, and plenty of upside. This two-story townhome offers a rare chance to purchase below the cost of a fully updated property while avoiding a full-scale renovation. The kitchen was completely remodeled last year, leaving the next owner with the opportunity to add value through cosmetic improvements and make the space their own. A smart buy for investors and buyers who know that sweat equity has the potential to pay off.
Key facts
- $105 HOA
- Built 1978
- Listed 2 days
Property features AI
Finance
- HOA & community: Homeowners association with a $105 monthly fee
Exterior
- Parking: Assigned parking
- Utilities: Public water; Public sewer; Electricity connected
- Home design: Townhouse; Attached property
- Exterior features: 0.06-acre lot
Interior
- Kitchen: Electric range; Microwave; Dishwasher; Refrigerator
- Bedrooms: 2 total rooms
- Bathrooms: 2 full bathrooms
- Heating & cooling: Central heating; Central air conditioning
- Interior features: Washer; Dryer; Refrigerator; Microwave; Electric range; Dishwasher
- Laundry & utility: Washer; Dryer
Neighborhood map
What this means for you Summary
Snapshot
- This is a 2-bed/2.0-bath townhouse listed at $160k.
Deal economics
- At list price, monthly cash flow is $-263 ($-3k/yr) — negative.
- To cash-flow at today's rent, offer at most $122k (23.8% below list).
- Meets the 1% rule at list price ($2k rent vs $160k).
- Recommended offer: $122k (23.8% below list) — sets the bar for cash-flow.
Location & tenants
- Location reads 80/100 on livability (#131 in FL, #1,957 nationally) — a professional / high-income tenant draw. Strengths: housing A+, health & safety A+, cost of living A; Watch: amenities D+, commute D+.
- Volusia (suburban): math 44% / reading 49% proficiency, ranked #47 of 73 in FL (top 64%) — families likely to look elsewhere, expect single-tenant / working-renter base with shorter leases.
- Market conditions: Rents soft (-2.7%/yr); 247 active listings in the ZIP; 37 comparable units currently listed for rent nearby; rentals at typical pace (median 21d on market — plan ~3-4 weeks tenant-placement turnaround); 3,402 units permitted in Volusia County in 2024 (681 in 5+ unit buildings).
- This rent runs 31% of the median local income ($68k/yr) — at the standard rent-burdened threshold; future hikes will face affordability resistance.
Forward outlook
- Local home prices are declining (-3.0%/yr); year-one equity from $1k of loan paydown is wiped out by about $5k of value loss. Plan a longer hold.
- Volusia County population projected at +19% by 2050 — long-run rental-demand tailwind backs the buy-and-hold thesis.
Negotiation context
- Only 2 days on market — expect competitive offers; lowballing is unlikely to land.
- Current owner paid $38k; list at $160k implies a 321% gain — meaningful room to come down on a strong offer.
Risks & watch-outs
- Watch-outs: flood insurance adds $427/mo.
- Climate carrying-cost: in FEMA flood zone AE (mandatory federal flood insurance); severe wind risk, 99% chance of damaging wind over 30y; extreme-heat days projected 7→20/yr by 2055 (HVAC capex compounding) — expect insurance premiums to compound above CPI over the hold.
Questions for the listing agent
- What do current leases actually rent for vs. the listed asking? Can we see a recent rent roll and the last 12 months of T-12 income?
- Built in 1978 — when were the roof, HVAC, electrical panel, plumbing, and water heater last replaced?
- What's the actual annual flood-insurance premium (NFIP or private), and is the property in a SFHA with mandatory coverage?
- What does the HOA fee cover, when was the last increase, and are there any pending special assessments or reserve-fund shortfalls?
- Is there a deadline driving the sale (1031 exchange, divorce, estate, relocation)? That informs how much negotiation room exists.
- Schools are B-rated — typically a magnet for longer-tenancy family renters. What's the average tenant stay here, and is there a school-zone premium baked into asking?
- What's the average days-on-market for RENTAL listings here right now (not sales)? A rising rental-DOM trend means longer vacancies and softer asking-rent achievability than the comps imply.
- What's the recent tenant-quality profile in this submarket — average credit score on applications, eviction rate, late-payment / NSF rate, and stable-employment percentage? A property-management company in the area should have these aggregated.
- How much new for-sale + rental construction is in the pipeline within 1–3 miles? Heavy new supply typically softens prices + rents 12–24 months out; constrained supply supports both.
Investment metrics
- 1% rule
- 1.09% ✓
- Cap rate
- 7.52%
- Cash-on-cash
- 4.39%
- DSCR
- 1.20
- GRM
- 7.7
CMA / ARV
No comps found within radius.
Projected returns pro-forma
-3.0% appreciation · 0.0% rent growth · sell at horizon
- IRR
- -33.8%
- Equity multiple
- -0.06×
- Total profit
- $-47,384
- Equity at exit
- $23,842
- IRR
- -81.0%
- Equity multiple
- -0.81×
- Total profit
- $-81,066
- Equity at exit
- $13,825
Cash invested: $44,772 (down + closing). Projections, not guarantees.
Landlord ↔ Tenant lean methodology
- Overall (STATE)
- 87 Strongly Landlord-Friendly
- State Florida
- 87 Strongly Landlord-Friendly · R+3
- County
- — inherits STATE
- City
- — inherits STATE
ZIP-level market 32129
- Rents YoY
- -2.7%
- Active inventory
- 247
- Price-to-rent
- 7.7×
Monthly cashflow live
- Estimated rent
- $1,739 high interval (Pro) →
- Mortgage (P&I)
- −$839
- Tax est. 1.5%
- −$200 /mo · $2,398/yr
- Insurance
- −$67
- Flood insurance flood zone
- −$427 /mo · $5,118/yr
- HOA
- −$105
- Vacancy / Maint / Mgmt
- −$365
- Net cashflow
- $-263
Break-even live
UW: 25.0% down · 7.5% · 30yr · 1.5% tax · 5.0% vac · 8.0% maint · 8.0% mgmt
Financing live
Cash to close
- Down payment
- $39,975
- Closing costs
- $4,797
- Reserves months
- —
- Total cash needed
- —
Loan-product check · same deal, 3 products live
Conventional
25% down · 7.5% · 30yr
- Down + closing
- —
- Monthly P&I
- —
- Monthly cashflow
- —
- DSCR
- —
- Eligible?
- —
Personal DTI + credit; lowest rate.
DSCR
20% down · 8.5% · 30yr
- Down + closing
- —
- Monthly P&I
- —
- Monthly cashflow
- —
- DSCR
- —
- Eligible?
- —
No personal income docs; deal must DSCR.
Hard money
10% down · 12.0% · 12mo
- Down + closing
- —
- Monthly P&I
- —
- Monthly cashflow
- —
- DSCR
- —
- Eligible?
- —
Short-term bridge; refi at stabilization.
Rent comps 37 comps
| Address | Beds | Baths | Sqft | Rent | $/sqft | DOM | Units | Dist |
|---|---|---|---|---|---|---|---|---|
| 190 Moonstone Ct Port Orange, FL | 2.0 | 2.0 | 1400 | $1,650 | $1.18 | 21d | 1 | 0.05mi |
| 104 Moonstone Ct Port Orange, FL | 2.0 | 2.0 | 1400 | $1,950 | $1.39 | 21d | 1 | 0.08mi |
| 86 Springwood Sq Unit 86 Port Orange, FL | 2.0 | 1.5 | 1249 | $1,450 | $1.16 | 21d | 1 | 0.16mi |
| 1206 Deer Springs Rd Port Orange, FL | 2.0 | 2.0 | 1064 | $1,625 | $1.53 | 14d | 1 | 0.20mi |
| 21 Springwood Sq Unit 23 Port Orange, FL | 2.0 | 1.5 | 1249 | $1,500 | $1.20 | 23d | 1 | 0.23mi |
| 3656 Jackson St Unit 1A Port Orange, FL | 2.0 | 1.5 | 1164 | $1,550 | $1.33 | 23d | 1 | 0.29mi |
| 3554 Irish Ln Port Orange, FL | 2.0 | 2.0 | 1470 | $2,000 | $1.36 | 23d | 1 | 0.42mi |
| 980 Canal View Blvd Port Orange, FL | 2.0 | 1.5 | 1024 | $1,448 | $1.41 | 23d | 2 | 0.47mi |
| 1032 W Samms Ave Port Orange, FL | 2.0 | 2.0 | 1176 | $1,650 | $1.40 | 14d | 1 | 0.58mi |
| 1111 Squirrel Nest Ln Port Orange, FL | 2.0 | 2.0 | 1169 | $1,900 | $1.63 | 14d | 1 | 0.65mi |
| 61 Brandy Hills Dr Port Orange, FL | 3.0 | 2.0 | 1192 | $1,895 | $1.59 | 23d | 1 | 0.70mi |
| 982 Commons Way Port Orange, FL | 3.0 | 2.0 | 1521 | $2,250 | $1.48 | 23d | 1 | 0.77mi |
| 488 Autumn Trl Port Orange, FL | 3.0 | 2.0 | 1393 | $1,499 | $1.08 | 23d | 1 | 0.89mi |
| 4211 New Haven Ct Port Orange, FL | 2.0 | 2.0 | 902 | $2,000 | $2.22 | 23d | 1 | 1.01mi |
| 1270 Reed Canal Rd Port Orange, FL | 1.0–3.0 | 1.0–2.0 | 1001 | $1,746 | $1.74 | 11d | 29 | 1.04mi |
| 1154 Ashland Ct Port Orange, FL | 3.0 | 2.0 | 1118 | $1,795 | $1.61 | 14d | 1 | 1.08mi |
| 910 Carey Dr South Daytona, FL | 3.0 | 2.0 | 1529 | $2,500 | $1.64 | 23d | 1 | 1.22mi |
| 1200 Floral Springs Blvd Port Orange, FL | 1.0–3.0 | 1.0–2.0 | 1047 | $1,780 | $1.70 | 11d | 81 | 1.24mi |
| 3835 Clyde Morris Blvd Port Orange, FL | 1.0–3.0 | 1.0–2.0 | 1013 | $2,012 | $1.99 | 11d | 17 | 1.28mi |
| 1401 Reed Canal Rd Port Orange, FL | 1.0–3.0 | 1.0–2.0 | 1045 | $1,856 | $1.78 | 14d | 25 | 1.28mi |
| 1010 N Swallow Tail Dr Port Orange, FL | 1.0–2.0 | 1.0–2.0 | 893 | $1,574 | $1.76 | 11d | 16 | 1.32mi |
| 3230 S Ridgewood Ave South Daytona, FL | 1.0–3.0 | 1.0–2.0 | 1046 | $1,881 | $1.80 | 11d | 27 | 1.33mi |
| 958 Village Trl Port Orange, FL | 1.0–2.0 | 1.0–2.0 | 775 | $1,455 | $1.88 | 11d | 12 | 1.37mi |
| 17 Bella Oaks Dr Port Orange, FL | 3.0 | 2.5 | 1624 | $2,150 | $1.32 | 23d | 1 | 1.37mi |
| 805 Louisville St Unit 2 Port Orange, FL | 2.0 | 2.0 | 1738 | $1,500 | $0.86 | 23d | 1 | 1.38mi |
| 805 Louisville St Unit 7 Port Orange, FL | 2.0 | 2.0 | 1738 | $1,525 | $0.88 | 23d | 1 | 1.38mi |
| 480 Reed Canal Rd #57 South Daytona, FL | 2.0 | 1.5 | 1024 | $1,550 | $1.51 | 23d | 1 | 1.38mi |
| 4514 Alder Dr Port Orange, FL | 3.0 | 2.0 | 1365 | $2,100 | $1.54 | 11d | 1 | 1.39mi |
| 53 Bella Oaks Dr Port Orange, FL | 3.0 | 2.5 | 1624 | $2,200 | $1.35 | 23d | 1 | 1.39mi |
| 940 Village Trl Unit 4-306 Port Orange, FL | 2.0 | 2.0 | 1006 | $2,000 | $1.99 | 14d | 1 | 1.42mi |
| 80 Bella Lago Cir Port Orange, FL | 3.0 | 2.5 | 1624 | $2,050 | $1.26 | 23d | 1 | 1.44mi |
| 66 Bella Lago Cir Port Orange, FL | 3.0 | 2.5 | 1624 | $2,050 | $1.26 | 23d | 1 | 1.46mi |
| 3780 Clyde Morris Blvd Port Orange, FL | 2.0–3.0 | 2.0 | 1050 | $1,369 | $1.30 | 11d | 12 | 1.47mi |
| 374 Windsor Dr Port Orange, FL | 3.0 | 2.0 | 1393 | $1,636 | $1.17 | 14d | 1 | 1.47mi |
| 1063 Wexford Way Port Orange, FL | 3.0 | 2.0 | 1773 | $2,700 | $1.52 | 11d | 1 | 1.47mi |
| 3131 S Ridgewood Ave #203 South Daytona, FL | 2.0 | 2.0 | 1013 | $1,795 | $1.77 | 14d | 1 | 1.47mi |
| 12 Downing Dr Port Orange, FL | 2.0 | 2.0 | 921 | $1,599 | $1.74 | 14d | 1 | 1.50mi |
HOA detail
- Monthly dues
- $105 · $1,260/yr
Listing history 3 events
-
2026-06-18days on market $159,900 Active 2 DOM
-
2026-06-16remarks 453-char remark
-
2026-06-16$159,900 Active 1 DOM
ⓘ Source: listings_history table (triggers on properties + properties_extension) + one-shot
backfill from property_details.listing_events for pre-trigger history.
Climate risk First Street
- Flood 7/10 Severe FEMA zone AE · 76% chance over 30 yrs
- Wildfire 1/10 Low
- Heat 9/10 Extreme 7 d/yr ≥105°F today · 20 d/yr by 30 yrs out
- Wind 10/10 Extreme 99% chance of damaging wind over 30 yrs
- Air quality 2/10 Low 1 unhealthy d/yr today · 1 by 30 yrs out
Nearby sold comps map
Loading sold comps map…
Walkable amenities ~0.75 mi
Loading nearby amenities…
Taxation est. · year 1
- Rental income
- $20,869
- − Mortgage interest
- −$8,957
- − Property taxes
- −$2,398
- − Insurance
- −$5,918
- − Repairs & maintenance
- −$1,670
- − Management
- −$1,670
- − HOA
- −$1,260
- − Depreciation
- −$4,652
- Taxable loss
- −$5,655
- Est. tax savings @ 24.0%
- +$1,357
- After-tax cash flow
- $-1,795/yr
For passive investors: Depreciation is non-cash, so a rental often shows a tax loss while cash-flowing — sheltering income. Rental losses are passive: they offset passive income freely, and up to $25,000/yr can offset ordinary (W-2) income if you actively participate and your MAGI is under $100k (phasing out to $0 by $150k); unused losses carry forward. On sale, claimed depreciation is recaptured at up to 25%, and gains may owe capital-gains tax (a 1031 exchange can defer both). Figures are a year-1 estimate at your 24.0% rate — not tax advice; consult a CPA.
Schools (NCES district)
- District
- Volusia
- NCES district ID
- 1201920
- Math proficiency
- 44% ▼ -9.00%
- Reading proficiency
- 49% ▼ -3.00%
- Median HH income
- $42,946
- Composite
- 39.2/100
- National rank
- #4019
- State rank
- #47 of 73 in FL
Livability — Port Orange
- Score
- 80/100
- State rank
- #131
- US rank
- #1957
Category grades
Schools grade is shown separately in the Schools card above.
Census & demographics
- Census place
- Port Orange, FL
- County
- Volusia County · 556,871 people
- City population
- 75,051
- Metro
- Deltona-Daytona Beach-Ormond Beach, FL
- Population (ZIP)
- 23,195
- Household income
- $67,924
- Rent vs Own
- Severe rent burden
- 602.0
Population outlook (Volusia County) Hauer SSP2
- Today (2025)
- 572,749 people
- By 2030
- 598,695 · +4.5%
- By 2040
- 644,880 · +12.6%
- By 2050
- 681,451 · +19.0%
- By 2075
- 759,957 · +32.7%
- By 2100
- 778,902 · +36.0%
Race, ethnicity, and origin ACS 2023
- Neighborhood character
- Predominantly White (80%)
- Race & ethnicity
- White 80% Hispanic / Latino 7% Two or more races 6% Black 6% Asian 3%
- Hispanic origin (detail)
- Mexican 2% Puerto Rican 3%
- Common ancestry
- Lithuanian 4% Iranian 3% Romanian 3%
- Foreign-born
- 9% · Canada, South Korea, China
- Languages at home
- 87% English-only · Spanish 4% German/W. Germanic 3% Arabic 1%
Political lean MEDSL · Volusia
- 2024 margin
- Strong R (+21.8) · D 38.7% · R 60.5%
- 2008→2024 swing
- -27.4pp toward R · 2008: 5.7pp · 2024: -21.8pp
- All cycles
- 2024: R+21.8 2020: R+14.1 2016: R+13.1 2012: R+1.2 2008: D+5.7
Not yet ingested
- Civics
- —
Market trends
- HPI YoY
- ▼ -234.13%
- Current HPI
- 310.0285
- Rent YoY
- ▼ -2.71%
- Metro
- Deltona-Daytona Beach-Ormond Beach, FL
- State GDP YoY
- ▲ 3.28%
- F500 in state
- 36
Industry mix (Fortune 500 HQ in FL)
| Industry | F500 HQs | Revenue |
|---|---|---|
| Industrial Technology | 2 | $29B |
|
||
| Insurance | 2 | $17B |
|
||
| Retail | 1 | $60B |
|
||
| Technology Distribution | 1 | $58B |
|
||
| Homebuilding | 1 | $35B |
|
||
| Technology Manufacturing | 1 | $35B |
|
||
Price history
+320.8% since first listed2 events — show timeline
- 2026-06-16 Listed $159,900 Daytona MLS
- 1996-05-02 Sold (Public Records) $38,000 Public Records
Property tax history
-3.6%/yrLatest (2025): $297 · +8.0% YoY. Source: county tax records.
Cash-flow waterfall
monthlySold comps — $/sqft
last 12 mo · ≤1 miLoading sold comps…