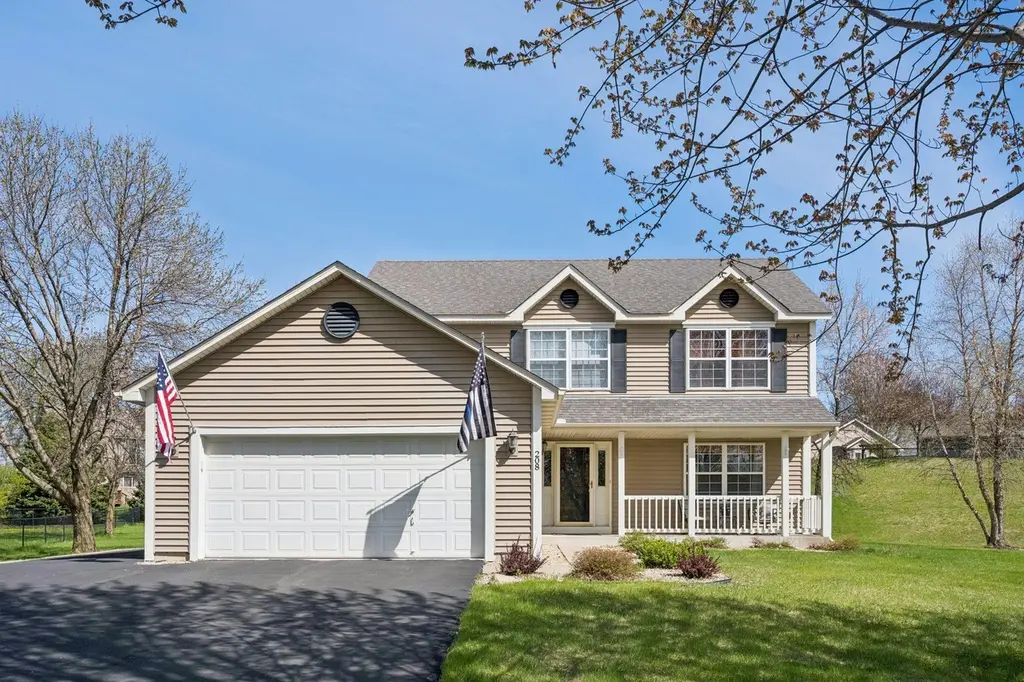
208 Cherrywood Ave NW
St. Michael, MN 55376
$414,900D+
5 bd · 3.0 ba ·
2,809 sqft ·
Built 2001
· SingleFamily
· Pending
· 4 DOM
Cashflow @ list (25.0% down · 7.5%)
Estimated rent
$3,492/mo
Mortgage (P&I)
−$2,176
Tax + insurance
−$562
HOA
−$0
Vac / Maint / Mgmt
−$733
Net cashflow
$21/mo
Annual
$250/yr
Cap rate
6.35%
Cash-on-cash
0.22%
DSCR
1.01
1% rule
0.84%
Cash to close
$116,172
Investor read
- This is a 5-bed/3.0-bath single-family listed at $415k.
- At list price, monthly cash flow is $21 ($250/yr) — positive.
- The deal already cash-flows at list — no discount required.
- To meet the 1% rule (rent ≥ 1% of price), the offer needs to be $349k (15.8% below list).
- Only 4 days on market — expect competitive offers; lowballing is unlikely to land.
- Recommended offer: $349k (15.8% below list) — sets the bar for 1% rule.
- Local home prices are declining (-3.0%/yr); year-one equity from $3k of loan paydown is wiped out by about $12k of value loss. Plan a longer hold.
- Location reads: area grade D — affects rentability + tenant quality, not the cash-flow math above.
- St. Michael-Albertville School District (rural): math 62% / reading 66% proficiency, ranked #17 of 301 in MN (top 6%) — acceptable for families but not a draw, mixed tenant base, ~2y average lease; only 9% free/reduced lunch — higher-income household profile.
- Zoned schools: Fieldstone Elementary School (math 76% / reading 67%, grade A-, #58 of 857 statewide, top 7%, 596 students, 24% FRL); St. Michael-Albertville Middle West (math 55% / reading 62%, grade B, #29 of 258 statewide, top 12%, 1,047 students, 21% FRL); St. Michael-Albertville Senior High (math 60% / reading 71%, grade B, #27 of 471 statewide, top 6%, 2,240 students, 17% FRL).
- Market conditions: 356 active listings in the ZIP; 3 comparable units currently listed for rent nearby; rentals leasing fast (median 1d on market — plan ~1-2 weeks tenant-placement turnaround); high-income renter base; 1,260 units permitted in Wright County in 2024 (180 in 5+ unit buildings).
- Wright County population projected at +9% by 2050 — modest demand growth; plan on rents tracking national, not racing it.
- Cap rate 6.4% vs local median 3.2% in St. Michael — top-decile yield for the area; either an underpriced asset or a hidden risk that comps aren't pricing in. Stress-test before assuming the spread holds.
- This rent runs 32% of the median local income ($131k/yr) — at the standard rent-burdened threshold; future hikes will face affordability resistance.
Questions for listing agent
- Is there a deadline driving the sale (1031 exchange, divorce, estate, relocation)? That informs how much negotiation room exists.
- The area grade is low — what's the realistic commute time and amenity access for the typical tenant pool here? Any planned neighborhood developments (good or bad) we should know about?
- What's the average days-on-market for RENTAL listings here right now (not sales)? A rising rental-DOM trend means longer vacancies and softer asking-rent achievability than the comps imply.
- What's the recent tenant-quality profile in this submarket — average credit score on applications, eviction rate, late-payment / NSF rate, and stable-employment percentage? A property-management company in the area should have these aggregated.
- How much new for-sale + rental construction is in the pipeline within 1–3 miles? Heavy new supply typically softens prices + rents 12–24 months out; constrained supply supports both.
CashFlowRE · CFR-13SMZ57QWCGNHP
· Data 4 weeks ago
cashflowre.app · 2026-05-29