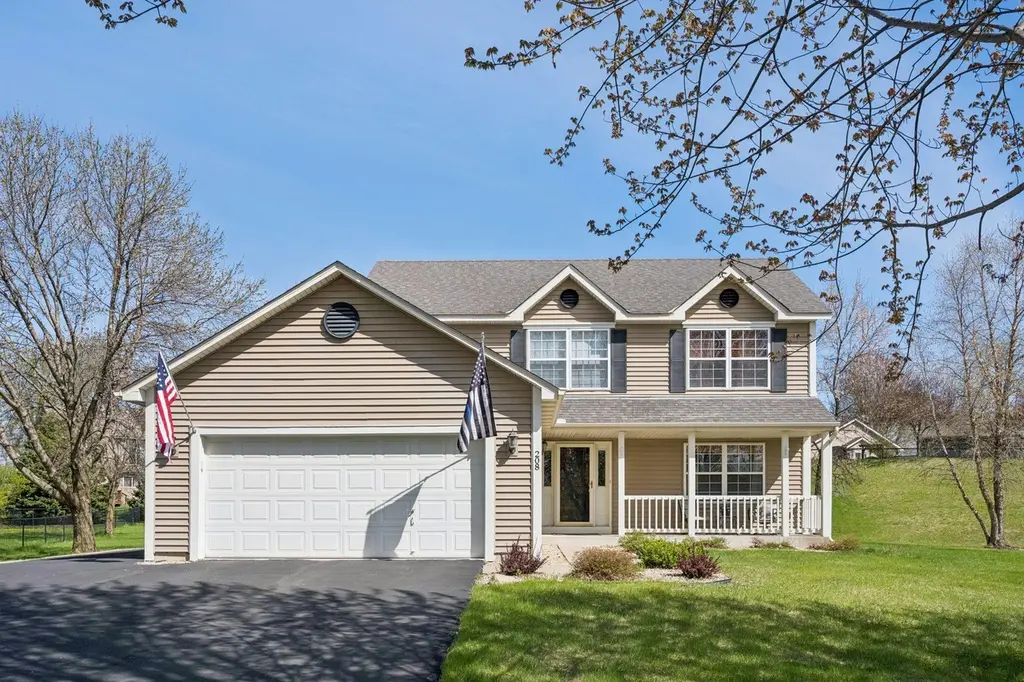
208 Cherrywood Ave NW · St. Michael, MN
Flood risk 1/10 · Minimal
- FEMA flood zone
- X
- Chance of flooding over 30 yrs
- 0.0%
- Est. flood insurance / yr
- $473 – $860
Fire risk 1/10 · Minimal
- Est. fire insurance / yr
- $888 – $1,650
Heat risk 2/10 · Minimal
- Hot days now (above 98°F)
- 7 days/yr
- Hot days in 30 yrs
- 14 days/yr
Wind risk 2/10 · Minimal
- Chance of severe wind over 30 yrs
- —
Air-quality risk 2/10 · Minimal
- Unhealthy air days now
- 1 days/yr
- Unhealthy air days in 30 yrs
- 2 days/yr
Risk factors via First Street. Map © Google.
Why this score? — see what drove the D+ grade
The composite is a weighted blend of 9 inputs, each scored 0–100. Each bar is that input's sub-score; the figure is the points it added to the 100-point composite (weight × sub-score).
- Cash flow +13.6/30.0
- ARV discount +11.5/15.0
- Schools +5.8/10.0
- DSCR +4.1/10.0
- 1% rule +3.4/10.0
- Rent growth +2.5/5.0
- Livability +2.5/5.0
- Condition / age +2.5/5.0
- Appreciation +0.0/10.0
$414,900
🖨 Deal sheet (PDF) 📄 Offer letter ✓ Due diligence
Listing remarks
* * * Multiple offers received. Offers are requested by 8:00pm on Sunday (5/3). Offers will be discussed with Sellers on Monday (5/4) at 8:00am. * * * This home lives large with its finished square footage and layout. From the welcoming front porch to the well-appointed interior, this home has amenities to enjoy! 5 bedrooms, 3 baths, and a finished basement provide ample space for you to use as you'd like. The main floor includes a nicely sized foyer with a coat closet, laundry area, 1/2 bath, living room, dining room, kitchen, and family room. An expansive deck and backyard are the perfect spaces to entertain and enjoy the seasons. BBQ’s, yard games, and gardening can all be acc
Key facts
- 0.57 acre lot
- 2 garage spots
- Built 2001
Property features AI
Exterior
- Parking: Attached garage (open access); 2-car garage with 21'x21' dimensions; Garage door approximately 7' high and 16' wide; Asphalt driveway
- Utilities: City water (connected); City sewer (connected); Natural gas; 150 amp electric service provided by Xcel Energy
- Home design: Residential property; Two levels; Block foundation
- Construction: Asphalt roof (over 8 years old)
- Exterior features: Vinyl exterior; Front porch; Deck; No pool; No fenced yard; Irregular lot with medium tree coverage; City street frontage with curbs and paved streets; Publicly maintained road
Interior
- Kitchen: Dishwasher; Disposal; Microwave; Range; Refrigerator; Eat-in kitchen
- Bedrooms: 5 bedrooms total; Primary bedroom suite on main level; Additional bedroom on lower level
- Bathrooms: 2 full bathrooms (including full primary bath); 1 half bathroom on main level
- Heating & cooling: Forced-air heating; Central air conditioning
- Interior features: Finished lower-level recreation room; Egress windows in basement; Basement storage space; Sump pump; Gas fireplace in family room; Water softener (owned); Eat-in kitchen and separate formal dining room; Main-floor half bath; Primary bedroom suite
- Laundry & utility: Main-level laundry; Dryer
Neighborhood map
What this means for you Summary
Snapshot
- This is a 5-bed/3.0-bath single-family listed at $415k.
Deal economics
- At list price, monthly cash flow is $21 ($250/yr) — positive.
- The deal already cash-flows at list — no discount required.
- To meet the 1% rule (rent ≥ 1% of price), the offer needs to be $349k (15.8% below list).
- Recommended offer: $349k (15.8% below list) — sets the bar for 1% rule.
- Cap rate 6.4% vs local median 3.2% in St. Michael — top-decile yield for the area; either an underpriced asset or a hidden risk that comps aren't pricing in. Stress-test before assuming the spread holds.
Location & tenants
- Location reads: area grade D — affects rentability + tenant quality, not the cash-flow math above.
- St. Michael-Albertville School District (rural): math 62% / reading 66% proficiency, ranked #17 of 301 in MN (top 6%) — acceptable for families but not a draw, mixed tenant base, ~2y average lease; only 9% free/reduced lunch — higher-income household profile.
- Zoned schools: Fieldstone Elementary School (math 76% / reading 67%, grade A-, #58 of 857 statewide, top 7%, 596 students, 24% FRL); St. Michael-Albertville Middle West (math 55% / reading 62%, grade B, #29 of 258 statewide, top 12%, 1,047 students, 21% FRL); St. Michael-Albertville Senior High (math 60% / reading 71%, grade B, #27 of 471 statewide, top 6%, 2,240 students, 17% FRL).
- Market conditions: 356 active listings in the ZIP; 3 comparable units currently listed for rent nearby; rentals leasing fast (median 0d on market — plan ~1-2 weeks tenant-placement turnaround); high-income renter base; 1,260 units permitted in Wright County in 2024 (180 in 5+ unit buildings).
- This rent runs 32% of the median local income ($131k/yr) — at the standard rent-burdened threshold; future hikes will face affordability resistance.
Forward outlook
- Local home prices are declining (-3.0%/yr); year-one equity from $3k of loan paydown is wiped out by about $12k of value loss. Plan a longer hold.
- Wright County population projected at +9% by 2050 — modest demand growth; plan on rents tracking national, not racing it.
Negotiation context
- Only 4 days on market — expect competitive offers; lowballing is unlikely to land.
Questions for the listing agent
- Is there a deadline driving the sale (1031 exchange, divorce, estate, relocation)? That informs how much negotiation room exists.
- The area grade is low — what's the realistic commute time and amenity access for the typical tenant pool here? Any planned neighborhood developments (good or bad) we should know about?
- What's the average days-on-market for RENTAL listings here right now (not sales)? A rising rental-DOM trend means longer vacancies and softer asking-rent achievability than the comps imply.
- What's the recent tenant-quality profile in this submarket — average credit score on applications, eviction rate, late-payment / NSF rate, and stable-employment percentage? A property-management company in the area should have these aggregated.
- How much new for-sale + rental construction is in the pipeline within 1–3 miles? Heavy new supply typically softens prices + rents 12–24 months out; constrained supply supports both.
Investment metrics
- 1% rule
- 0.84% ✗
- Cap rate
- 6.35%
- Cash-on-cash
- 0.22%
- DSCR
- 1.01
- GRM
- 9.9
CMA / ARV
- ARV (median comp)
- $455,610
- List price
- $414,900
- Delta
- -8.94%
- Verdict
- FAIR
- Comps
- 2 within 1.0 mi
Show comp detail 1 sale within ~0.75 mi
| Address | Dist | Beds/Ba | Sqft | Sold | Price | $/sf | Match |
|---|---|---|---|---|---|---|---|
| 10582 49th St NE | 0.70mi | 5/4.0 | 3,014 (+7%) | 12mo | $479,900 | $159 | 42 |
Match score weights: distance 35% · size 25% · config 20% · recency 20%. Top-matched comps best support the ARV.
Projected returns pro-forma
-3.0% appreciation · 3.0% rent growth · sell at horizon
- IRR
- -16.0%
- Equity multiple
- 0.43×
- Total profit
- $-65,931
- Equity at exit
- $61,863
- IRR
- -7.6%
- Equity multiple
- 0.52×
- Total profit
- $-55,811
- Equity at exit
- $35,873
Cash invested: $116,172 (down + closing). Projections, not guarantees.
Landlord ↔ Tenant lean methodology
- Overall (STATE)
- 46 Balanced
- State Minnesota
- 46 Balanced · D+2
- County
- — inherits STATE
- City
- — inherits STATE
ZIP-level market 55376
- Home prices YoY
- -30.4%
- Active inventory
- 356
- Price-to-rent
- 9.9×
Monthly cashflow live
- Estimated rent
- $3,492 medium interval (Pro) →
- Mortgage (P&I)
- −$2,176
- Tax from tax record
- −$389 /mo · $4,670/yr
- Insurance
- −$173
- HOA
- −$0
- Vacancy / Maint / Mgmt
- −$733
- Net cashflow
- $21
Break-even live
Sensitivity live
| Price | -10% $256 | -5% $138 | +0% $21 | +5% $-97 | +10% $-214 |
|---|---|---|---|---|---|
| Rent | -10% $-255 | -5% $-117 | +0% $21 | +5% $159 | +10% $297 |
| Rate | -1.0pp $230 | -0.5pp $126 | base $21 | +0.5pp $-87 | +1.0pp $-196 |
UW: 25.0% down · 7.5% · 30yr · 1.5% tax · 5.0% vac · 8.0% maint · 8.0% mgmt
Financing live
Cash to close
- Down payment
- $103,725
- Closing costs
- $12,447
- Reserves months
- —
- Total cash needed
- —
Loan-product check · same deal, 3 products live
Conventional
25% down · 7.5% · 30yr
- Down + closing
- —
- Monthly P&I
- —
- Monthly cashflow
- —
- DSCR
- —
- Eligible?
- —
Personal DTI + credit; lowest rate.
DSCR
20% down · 8.5% · 30yr
- Down + closing
- —
- Monthly P&I
- —
- Monthly cashflow
- —
- DSCR
- —
- Eligible?
- —
No personal income docs; deal must DSCR.
Hard money
10% down · 12.0% · 12mo
- Down + closing
- —
- Monthly P&I
- —
- Monthly cashflow
- —
- DSCR
- —
- Eligible?
- —
Short-term bridge; refi at stabilization.
Rent comps 3 comps
| Address | Beds | Baths | Sqft | Rent | $/sqft | DOM | Units | Dist |
|---|---|---|---|---|---|---|---|---|
| 5055 Lander Ave NE Albertville, MN | 2.0–5.0 | 2.0–3.5 | 2067 | $4,082 | $1.97 | 0d | 7 | 0.83mi |
| 305 Circle Ln SE Saint Michael, MN | 5.0 | 3.0 | 3098 | $3,150 | $1.02 | 0d | 1 | 1.03mi |
| 4527 Mason Ave NE Saint Michael, MN | 5.0 | 4.0 | 3785 | $3,469 | $0.92 | 3d | 1 | 1.43mi |
Listing history 4 events
-
2026-05-04status Pending 1196-char remark
-
2026-05-01$414,900 Active 1196-char remark
-
2026-04-29historical $414,900 1196-char remark
-
2001-05-11soldstatus $185,465
ⓘ Source: listings_history table (triggers on properties + properties_extension) + one-shot
backfill from property_details.listing_events for pre-trigger history.
Tax reassessment forecast MN · Partial reset (capped growth)
- Current annual tax
- $4,670 · $389/mo
- Projected year-2 tax
- $4,670 · $389/mo
- Expected delta
- $0/yr ($0/mo · 0.0%)
ⓘ Screening estimate from a state-policy table — verify with the county assessor before closing.
Climate risk First Street
- Flood 1/10 Low FEMA zone X · 0% chance over 30 yrs
- Wildfire 1/10 Low
- Heat 2/10 Low 7 d/yr ≥98°F today · 14 d/yr by 30 yrs out
- Wind 2/10 Low
- Air quality 2/10 Low 1 unhealthy d/yr today · 2 by 30 yrs out
Nearby sold comps map
Loading sold comps map…
Walkable amenities ~0.75 mi
Loading nearby amenities…
Taxation est. · year 1
- Rental income
- $41,904
- − Mortgage interest
- −$23,241
- − Property taxes
- −$4,670
- − Insurance
- −$2,074
- − Repairs & maintenance
- −$3,352
- − Management
- −$3,352
- − Depreciation
- −$12,070
- Taxable loss
- −$6,856
- Est. tax savings @ 24.0%
- +$1,645
- After-tax cash flow
- $1,896/yr
For passive investors: Depreciation is non-cash, so a rental often shows a tax loss while cash-flowing — sheltering income. Rental losses are passive: they offset passive income freely, and up to $25,000/yr can offset ordinary (W-2) income if you actively participate and your MAGI is under $100k (phasing out to $0 by $150k); unused losses carry forward. On sale, claimed depreciation is recaptured at up to 25%, and gains may owe capital-gains tax (a 1031 exchange can defer both). Figures are a year-1 estimate at your 24.0% rate — not tax advice; consult a CPA.
Schools (NCES district)
- District
- St. Michael-Albertville School District
- NCES district ID
- 2733790
- Math proficiency
- 62% ▼ -13.00%
- Reading proficiency
- 66% ▼ -10.00%
- Median HH income
- $86,897
- Composite
- 57.91/100
- National rank
- #1042
- State rank
- #17 of 301 in MN
Livability — St. Michael
No livability data for this city. (Only ~50 U.S. cities are tracked.)
Census & demographics
- Census place
- St. Michael, MN
- County
- Wright County · 79,164 people
- City population
- 19,317
- Metro
- Minneapolis-St. Paul-Bloomington, MN-WI
- Population (ZIP)
- 20,106
- Household income
- $131,266
- Rent vs Own
- Severe rent burden
- 132.0
Population outlook (Wright County) Hauer SSP2
- Today (2025)
- 142,526 people
- By 2030
- 146,915 · +3.1%
- By 2040
- 153,625 · +7.8%
- By 2050
- 155,416 · +9.0%
- By 2075
- 150,352 · +5.5%
- By 2100
- 130,631 · -8.3%
Race, ethnicity, and origin ACS 2023
- Neighborhood character
- Predominantly White (87%)
- Race & ethnicity
- White 87% Black 4% Two or more races 4% Hispanic / Latino 3% Asian 3%
- Common ancestry
- Portuguese 13% Romanian 5% Lithuanian 4%
- Foreign-born
- 4% · Canada, South Korea, Vietnam
- Languages at home
- 95% English-only · Spanish 2% Other Asian/Pacific 1% German/W. Germanic 1%
Political lean MEDSL · Wright
- 2024 margin
- Strong R (+29.4) · D 34.4% · R 63.8% · Other 1.8%
- 2008→2024 swing
- -11.9pp toward R · 2008: -17.4pp · 2024: -29.4pp
- All cycles
- 2024: R+29.4 2020: R+28.6 2016: R+33.2 2012: R+21.4 2008: R+17.4
Not yet ingested
- Civics
- —
Market trends
- HPI YoY
- ▼ -100.03%
- Current HPI
- 229.5977
- Rent YoY
- —
- Metro
- Minneapolis-St. Paul-Bloomington, MN-WI
- State GDP YoY
- ▲ 2.41%
- F500 in state
- 34
Industry mix (Fortune 500 HQ in MN)
| Industry | F500 HQs | Revenue |
|---|---|---|
| Healthcare | 2 | $407B |
|
||
| Retail | 2 | $150B |
|
||
| Consumer Goods | 2 | $32B |
|
||
| Industrial Machinery | 2 | $6B |
|
||
| Agriculture | 1 | $40B |
|
||
| Healthcare / Medical Devices | 1 | $32B |
|
||
Price history
+131.8% since first listed5 events — show timeline
- 2026-06-01 Sold (MLS) $430,000 NORTHSTARMLS as Distributed by MLS Grid
- 2026-05-04 Pending — NORTHSTARMLS as Distributed by MLS Grid
- 2026-05-01 Listed $414,900 NORTHSTARMLS as Distributed by MLS Grid
- 2026-04-29 Coming Soon $414,900 NORTHSTARMLS as Distributed by MLS Grid
- 2001-05-11 Sold (MLS) $185,465 NORTHSTARMLS as Distributed by MLS Grid
Property tax history
+3.3%/yrLatest (2025): $4,670 · +1.4% YoY. Source: county tax records.
Cash-flow waterfall
monthlySold comps — $/sqft
last 12 mo · ≤1 miLoading sold comps…