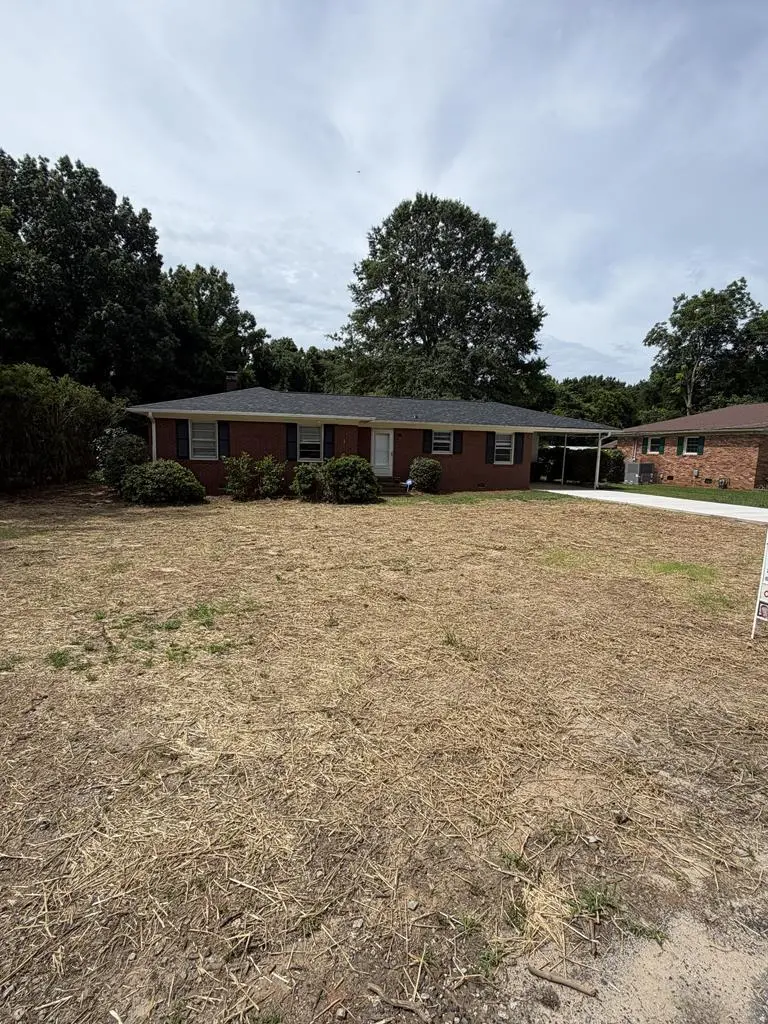
109 Westgate Dr
Greenwood, SC 29646
$239,900C-
3 bd · 2.0 ba ·
1,450 sqft ·
Built 1961
· Other
· Active
· 4 DOM
Cashflow @ list (25.0% down · 7.5%)
Estimated rent
$2,548/mo
Mortgage (P&I)
−$1,258
Tax + insurance
−$391
HOA
−$0
Vac / Maint / Mgmt
−$535
Net cashflow
$364/mo
Annual
$4,370/yr
Cap rate
8.11%
Cash-on-cash
6.51%
DSCR
1.29
1% rule
1.06%
Cash to close
$67,172
Investor read
- This is a 3-bed/2.0-bath other listed at $240k.
- At list price, monthly cash flow is $364 ($4k/yr) — positive.
- The deal already cash-flows at list — no discount required.
- Meets the 1% rule at list price ($3k rent vs $240k).
- Only 4 days on market — expect competitive offers; lowballing is unlikely to land.
- Local home prices are declining (-3.0%/yr); year-one equity from $2k of loan paydown is wiped out by about $7k of value loss. Plan a longer hold.
- Location reads 63/100 on livability (#167 in SC) — a middle-class / working-renter tenant base. Strengths: cost of living A+, health & safety A+, housing A; Watch: amenities D, schools F, crime F.
- Greenwood 50 (town): math 31% / reading 39% proficiency, ranked #43 of 80 in SC (top 54%) — families likely to look elsewhere, expect single-tenant / working-renter base with shorter leases.
- Market conditions: 168 active listings in the ZIP; 4 comparable units currently listed for rent nearby; rentals at typical pace (median 24d on market — plan ~3-4 weeks tenant-placement turnaround); 193 units permitted in Greenwood County in 2024 (0 in 5+ unit buildings).
- Greenwood County population projected to shrink 8% by 2050 — rents likely to lag national; underwrite the cash flow, not the appreciation.
- 2 sale attempts since 4y ago; this cycle's ask is 7% above the opening price — seller raised mid-cycle; expect resistance to lowballs.
- Current owner paid $175k; 37% above their basis — modest negotiation headroom, anchor on the comps not their cost.
- Climate carrying-cost: major wind risk, 27% chance of damaging wind over 30y; extreme-heat days projected 7→17/yr by 2055 (HVAC capex compounding) — expect insurance premiums to compound above CPI over the hold.
- Cap rate 8.1% vs local median 3.6% in Greenwood — top-decile yield for the area; either an underpriced asset or a hidden risk that comps aren't pricing in. Stress-test before assuming the spread holds.
Questions for listing agent
- Built in 1961 — when were the roof, HVAC, electrical panel, plumbing, and water heater last replaced?
- Is there a deadline driving the sale (1031 exchange, divorce, estate, relocation)? That informs how much negotiation room exists.
- Schools are F-rated, which usually means shorter tenancies and higher turnover. Who's the typical renter profile here, and what's been the actual vacancy rate?
- Crime grade is F in this area — have there been break-ins, vandalism, or insurance claims at this property in the last 3 years? What carrier currently insures it and at what premium?
- What's the average days-on-market for RENTAL listings here right now (not sales)? A rising rental-DOM trend means longer vacancies and softer asking-rent achievability than the comps imply.
- What's the recent tenant-quality profile in this submarket — average credit score on applications, eviction rate, late-payment / NSF rate, and stable-employment percentage? A property-management company in the area should have these aggregated.
- How much new for-sale + rental construction is in the pipeline within 1–3 miles? Heavy new supply typically softens prices + rents 12–24 months out; constrained supply supports both.
CashFlowRE · CFR-13Y8JSF7354PFN
· Data 22 h ago
cashflowre.app · 2026-05-29