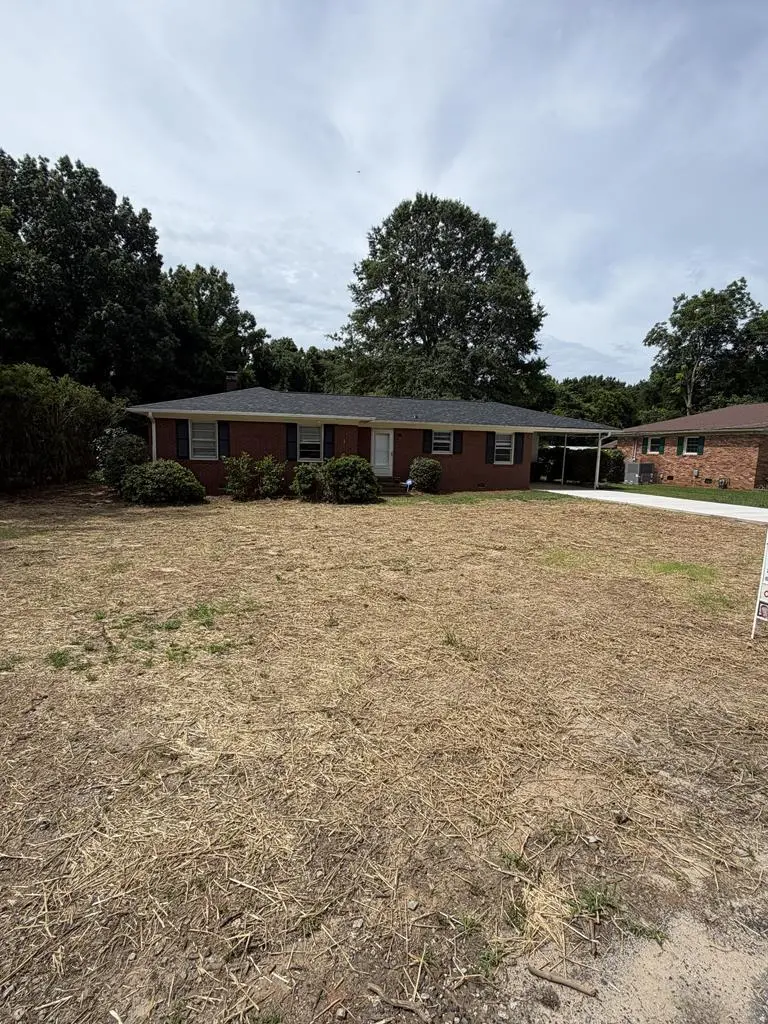
109 Westgate Dr · Greenwood, SC
Flood risk 1/10 · Minimal
- FEMA flood zone
- X (unshaded)
- Chance of flooding over 30 yrs
- 0.0%
- Est. flood insurance / yr
- $507 – $1,088
Fire risk 2/10 · Minimal
- Est. fire insurance / yr
- $783 – $1,453
Heat risk 6/10 · Moderate
- Hot days now (above 106°F)
- 7 days/yr
- Hot days in 30 yrs
- 17 days/yr
Wind risk 6/10 · Moderate
- Chance of severe wind over 30 yrs
- 27.0%
Air-quality risk 4/10 · Minor
- Unhealthy air days now
- 4 days/yr
- Unhealthy air days in 30 yrs
- 4 days/yr
Risk factors via First Street. Map © Google.
Why this score? — see what drove the C- grade
The composite is a weighted blend of 9 inputs, each scored 0–100. Each bar is that input's sub-score; the figure is the points it added to the 100-point composite (weight × sub-score).
- Cash flow +21.6/30.0
- ARV discount +7.5/15.0
- DSCR +6.9/10.0
- 1% rule +5.6/10.0
- Livability +3.2/5.0
- Schools +2.9/10.0
- Rent growth +2.5/5.0
- Condition / age +2.5/5.0
- Appreciation +0.0/10.0
$239,900
🖨 Deal sheet 📄 Offer letter ✓ Due diligence
Listing remarks
OLD DUKE RATE home!!! Trees in front of the home and around the property were removed. NEW Roof! New Concrete Driveway installed after trees were removed. The lawn was recently seeded with grass seed. . Welcome to 109 Westgate Drive in beautiful Greenwood, SC! This recently updated 3 bed, 2 bath home is a true gem on the west side of town. Step inside to find a spacious interior with modern finishes throughout. The updated kitchen and bathrooms are sure to impress, offering both style and functionality. Outside, you'll find a large yard with mature trees and landscaping, providing a serene outdoor oasis. The fenced-in backyard offers privacy and security, perfect for pets or children to pla
Key facts
- Recently seeded lawn
- Fenced in backyard
- Large yard
Tags
Property features AI
Exterior
- Parking: Attached garage
- Security: Security system
- Utilities: Septic tank
- Home design: Single-family detached residence; One-story
- Construction: Brick construction; Composition roof
- Exterior features: Chain link fencing; Level lot
Interior
- Kitchen: Microwave; Refrigerator
- Flooring: Hardwood flooring; Vinyl flooring
- Bathrooms: 2 full bathrooms
- Heating & cooling: Central air conditioning; Natural gas heating
- Interior features: Security system
Neighborhood map
What this means for you Summary
Snapshot
- This is a 3-bed/2.0-bath other listed at $240k.
Deal economics
- At list price, monthly cash flow is $364 ($4k/yr) — positive.
- The deal already cash-flows at list — no discount required.
- Meets the 1% rule at list price ($3k rent vs $240k).
- Cap rate 8.1% vs local median 3.6% in Greenwood — top-decile yield for the area; either an underpriced asset or a hidden risk that comps aren't pricing in. Stress-test before assuming the spread holds.
Location & tenants
- Location reads 63/100 on livability (#167 in SC) — a middle-class / working-renter tenant base. Strengths: cost of living A+, health & safety A+, housing A; Watch: amenities D, schools F, crime F.
- Greenwood 50 (town): math 31% / reading 39% proficiency, ranked #43 of 80 in SC (top 54%) — families likely to look elsewhere, expect single-tenant / working-renter base with shorter leases.
- Market conditions: 168 active listings in the ZIP; 4 comparable units currently listed for rent nearby; rentals at typical pace (median 24d on market — plan ~3-4 weeks tenant-placement turnaround); 193 units permitted in Greenwood County in 2024 (0 in 5+ unit buildings).
Forward outlook
- Local home prices are declining (-3.0%/yr); year-one equity from $2k of loan paydown is wiped out by about $7k of value loss. Plan a longer hold.
- Greenwood County population projected to shrink 8% by 2050 — rents likely to lag national; underwrite the cash flow, not the appreciation.
Negotiation context
- Only 4 days on market — expect competitive offers; lowballing is unlikely to land.
- 2 sale attempts since 4y ago; this cycle's ask is 7% above the opening price — seller raised mid-cycle; expect resistance to lowballs.
- Current owner paid $175k; 37% above their basis — modest negotiation headroom, anchor on the comps not their cost.
Risks & watch-outs
- Climate carrying-cost: major wind risk, 27% chance of damaging wind over 30y; extreme-heat days projected 7→17/yr by 2055 (HVAC capex compounding) — expect insurance premiums to compound above CPI over the hold.
Questions for the listing agent
- Built in 1961 — when were the roof, HVAC, electrical panel, plumbing, and water heater last replaced?
- Is there a deadline driving the sale (1031 exchange, divorce, estate, relocation)? That informs how much negotiation room exists.
- Schools are F-rated, which usually means shorter tenancies and higher turnover. Who's the typical renter profile here, and what's been the actual vacancy rate?
- Crime grade is F in this area — have there been break-ins, vandalism, or insurance claims at this property in the last 3 years? What carrier currently insures it and at what premium?
- What's the average days-on-market for RENTAL listings here right now (not sales)? A rising rental-DOM trend means longer vacancies and softer asking-rent achievability than the comps imply.
- What's the recent tenant-quality profile in this submarket — average credit score on applications, eviction rate, late-payment / NSF rate, and stable-employment percentage? A property-management company in the area should have these aggregated.
- How much new for-sale + rental construction is in the pipeline within 1–3 miles? Heavy new supply typically softens prices + rents 12–24 months out; constrained supply supports both.
Investment metrics
- 1% rule
- 1.06% ✓
- Cap rate
- 8.11%
- Cash-on-cash
- 6.51%
- DSCR
- 1.29
- GRM
- 7.8
CMA / ARV
No comps found within radius.
Projected returns pro-forma
-3.0% appreciation · 3.0% rent growth · sell at horizon
- IRR
- -6.3%
- Equity multiple
- 0.77×
- Total profit
- $-15,649
- Equity at exit
- $35,770
- IRR
- 3.4%
- Equity multiple
- 1.24×
- Total profit
- $16,370
- Equity at exit
- $20,742
Cash invested: $67,172 (down + closing). Projections, not guarantees.
Landlord ↔ Tenant lean methodology
- Overall (STATE)
- 90 Strongly Landlord-Friendly
- State South Carolina
- 90 Strongly Landlord-Friendly · R+6
- County
- — inherits STATE
- City
- — inherits STATE
ZIP-level market 29646
- Active inventory
- 168
- Price-to-rent
- 7.8×
Monthly cashflow live
- Estimated rent
- $2,548 medium interval (Pro) →
- Mortgage (P&I)
- −$1,258
- Tax from tax record
- −$291 /mo · $3,494/yr
- Insurance
- −$100
- HOA
- −$0
- Vacancy / Maint / Mgmt
- −$535
- Net cashflow
- $364
Break-even live
UW: 25.0% down · 7.5% · 30yr · 1.5% tax · 5.0% vac · 8.0% maint · 8.0% mgmt
Financing live
Cash to close
- Down payment
- $59,975
- Closing costs
- $7,197
- Reserves months
- —
- Total cash needed
- —
Loan-product check · same deal, 3 products live
Conventional
25% down · 7.5% · 30yr
- Down + closing
- —
- Monthly P&I
- —
- Monthly cashflow
- —
- DSCR
- —
- Eligible?
- —
Personal DTI + credit; lowest rate.
DSCR
20% down · 8.5% · 30yr
- Down + closing
- —
- Monthly P&I
- —
- Monthly cashflow
- —
- DSCR
- —
- Eligible?
- —
No personal income docs; deal must DSCR.
Hard money
10% down · 12.0% · 12mo
- Down + closing
- —
- Monthly P&I
- —
- Monthly cashflow
- —
- DSCR
- —
- Eligible?
- —
Short-term bridge; refi at stabilization.
Rent comps 4 comps
| Address | Beds | Baths | Sqft | Rent | $/sqft | DOM | Units | Dist |
|---|---|---|---|---|---|---|---|---|
| 104 Woodhaven Ct Unit 104 Greenwood, SC | 2.0 | 2.0 | 1305 | $2,500 | $1.92 | 23d | 1 | 0.84mi |
| 218 Woodhaven Ct Greenwood, SC | 2.0 | 2.0 | 1218 | $2,600 | $2.13 | 23d | 1 | 0.86mi |
| 218 Woodhaven Ct Unit 218 Greenwood, SC | 2.0 | 2.0 | 1218 | $2,600 | $2.13 | 14d | 1 | 0.86mi |
| 210 Woodhaven Ct Unit 210 Greenwood, SC | 2.0 | 2.0 | 1305 | $2,500 | $1.92 | 23d | 1 | 0.89mi |
Listing history 20 events
-
2026-06-19days on market $239,900 Active 4 DOM
-
2026-06-18days on market $239,900 Active 3 DOM
-
2026-06-17days on market $239,900 Active 2 DOM
-
2026-06-16days on market $239,900 Active 1 DOM
-
2026-05-30days on market $239,900 Active 191 DOM
-
2026-05-08price $239,900
-
2026-01-27price $235,000
-
2025-12-09price $219,900
-
2025-11-20$224,900 Active
-
2025-10-20price $224,900
-
2025-09-29price $234,900
-
2025-09-08price $239,900
-
2025-07-22price $239,900
-
2025-04-25price $249,900
-
2024-12-07price $260,000
-
2024-11-18price $270,000
-
2022-09-01soldstatus $175,000
-
2022-08-31soldstatus $175,000
-
2022-06-01$200,000
-
2015-09-22soldstatus $80,000
ⓘ Source: listings_history table (triggers on properties + properties_extension) + one-shot
backfill from property_details.listing_events for pre-trigger history.
Tax reassessment forecast SC · Resets to sale price
- Current annual tax
- $3,494 · $291/mo
- Projected year-2 tax
- $3,494 · $291/mo
- Expected delta
- $0/yr ($0/mo · 0.0%)
ⓘ Screening estimate from a state-policy table — verify with the county assessor before closing.
Climate risk First Street
- Flood 1/10 Low FEMA zone X (unshaded) · 0% chance over 30 yrs
- Wildfire 2/10 Low
- Heat 6/10 Major 7 d/yr ≥106°F today · 17 d/yr by 30 yrs out
- Wind 6/10 Major 27% chance of damaging wind over 30 yrs
- Air quality 4/10 Moderate 4 unhealthy d/yr today · 4 by 30 yrs out
Nearby sold comps map
Loading sold comps map…
Walkable amenities ~0.75 mi
Loading nearby amenities…
Taxation est. · year 1
- Rental income
- $30,582
- − Mortgage interest
- −$13,438
- − Property taxes
- −$3,494
- − Insurance
- −$1,200
- − Repairs & maintenance
- −$2,447
- − Management
- −$2,447
- − Depreciation
- −$6,979
- Taxable income
- $578
- Est. tax owed @ 24.0%
- −$139
- After-tax cash flow
- $4,231/yr
For passive investors: Depreciation is non-cash, so a rental often shows a tax loss while cash-flowing — sheltering income. Rental losses are passive: they offset passive income freely, and up to $25,000/yr can offset ordinary (W-2) income if you actively participate and your MAGI is under $100k (phasing out to $0 by $150k); unused losses carry forward. On sale, claimed depreciation is recaptured at up to 25%, and gains may owe capital-gains tax (a 1031 exchange can defer both). Figures are a year-1 estimate at your 24.0% rate — not tax advice; consult a CPA.
Schools (NCES district)
- District
- Greenwood 50
- NCES district ID
- 4502340
- Math proficiency
- 31% ▼ -4.00%
- Reading proficiency
- 39% ▲ 2.00%
- Median HH income
- $37,663
- Composite
- 29.14/100
- National rank
- #6585
- State rank
- #43 of 80 in SC
Livability — Greenwood
- Score
- 63/100
- State rank
- #167
- US rank
- #15097
Category grades
Schools grade is shown separately in the Schools card above.
Census & demographics
- City population
- 26,275
- Population (ZIP)
- 28,413
Population outlook (Greenwood County) Hauer SSP2
- Today (2025)
- 69,627 people
- By 2030
- 68,905 · -1.0%
- By 2040
- 66,640 · -4.3%
- By 2050
- 63,768 · -8.4%
- By 2075
- 55,769 · -19.9%
- By 2100
- 47,293 · -32.1%
Race, ethnicity, and origin ACS 2023
- Neighborhood character
- Diverse neighborhood (Simpson 0.61)
- Race & ethnicity
- White 44% Black 43% Hispanic / Latino 10% Two or more races 3%
- Hispanic origin (detail)
- Mexican 9%
- Common ancestry
- Slovak 1% Serbian 1% Lithuanian 1%
- Foreign-born
- 5% · Canada, Dominican Republic
- Languages at home
- 92% English-only · Spanish 7%
Political lean MEDSL · Greenwood
- 2024 margin
- Strong R (+29.0) · D 34.9% · R 63.8% · Other 1.3%
- 2008→2024 swing
- -13.3pp toward R · 2008: -15.7pp · 2024: -29.0pp
- All cycles
- 2024: R+29.0 2020: R+22.8 2016: R+21.8 2012: R+15.4 2008: R+15.7
Not yet ingested
- Civics
- —
Market trends
- HPI YoY
- ▼ -208.03%
- Current HPI
- 153.1055
- Rent YoY
- —
- Metro
- —
- State GDP YoY
- ▲ 4.51%
- F500 in state
- 2
Industry mix (Fortune 500 HQ in SC)
| Industry | F500 HQs | Revenue |
|---|---|---|
| Packaging | 1 | $7B |
|
||
Price history
+199.9% since first listed15 events — show timeline
- 2026-05-08 Price Changed $239,900 GAOR
- 2026-01-27 Price Changed $235,000 GAOR
- 2025-12-09 Price Changed $219,900 GAOR
- 2025-11-20 Listed $224,900 GAOR
- 2025-10-20 Price Changed $224,900 GAOR
- 2025-09-29 Price Changed $234,900 GAOR
- 2025-09-08 Price Changed $239,900 GAOR
- 2025-07-22 Price Changed $239,900 GAOR
- 2025-04-25 Price Changed $249,900 GAOR
- 2024-12-07 Price Changed $260,000 GAOR
- 2024-11-18 Price Changed $270,000 GAOR
- 2022-09-01 Sold (Public Records) $175,000 Public Records
- 2022-08-31 Sold (MLS) $175,000 GAOR
- 2022-06-01 Listed $200,000 GAOR
- 2015-09-22 Sold (Public Records) $80,000 Public Records
Property tax history
+5.7%/yrLatest (2025): $3,494 · +195.9% YoY. Source: county tax records.
Cash-flow waterfall
monthlySold comps — $/sqft
last 12 mo · ≤1 miLoading sold comps…